EURUSD Candlestick Analysis & Signal History
Real-time Forex trading signals with RSI divergence, pattern detection and risk management levels for EURUSD.
Learn how to trade these signalsCurrent Market
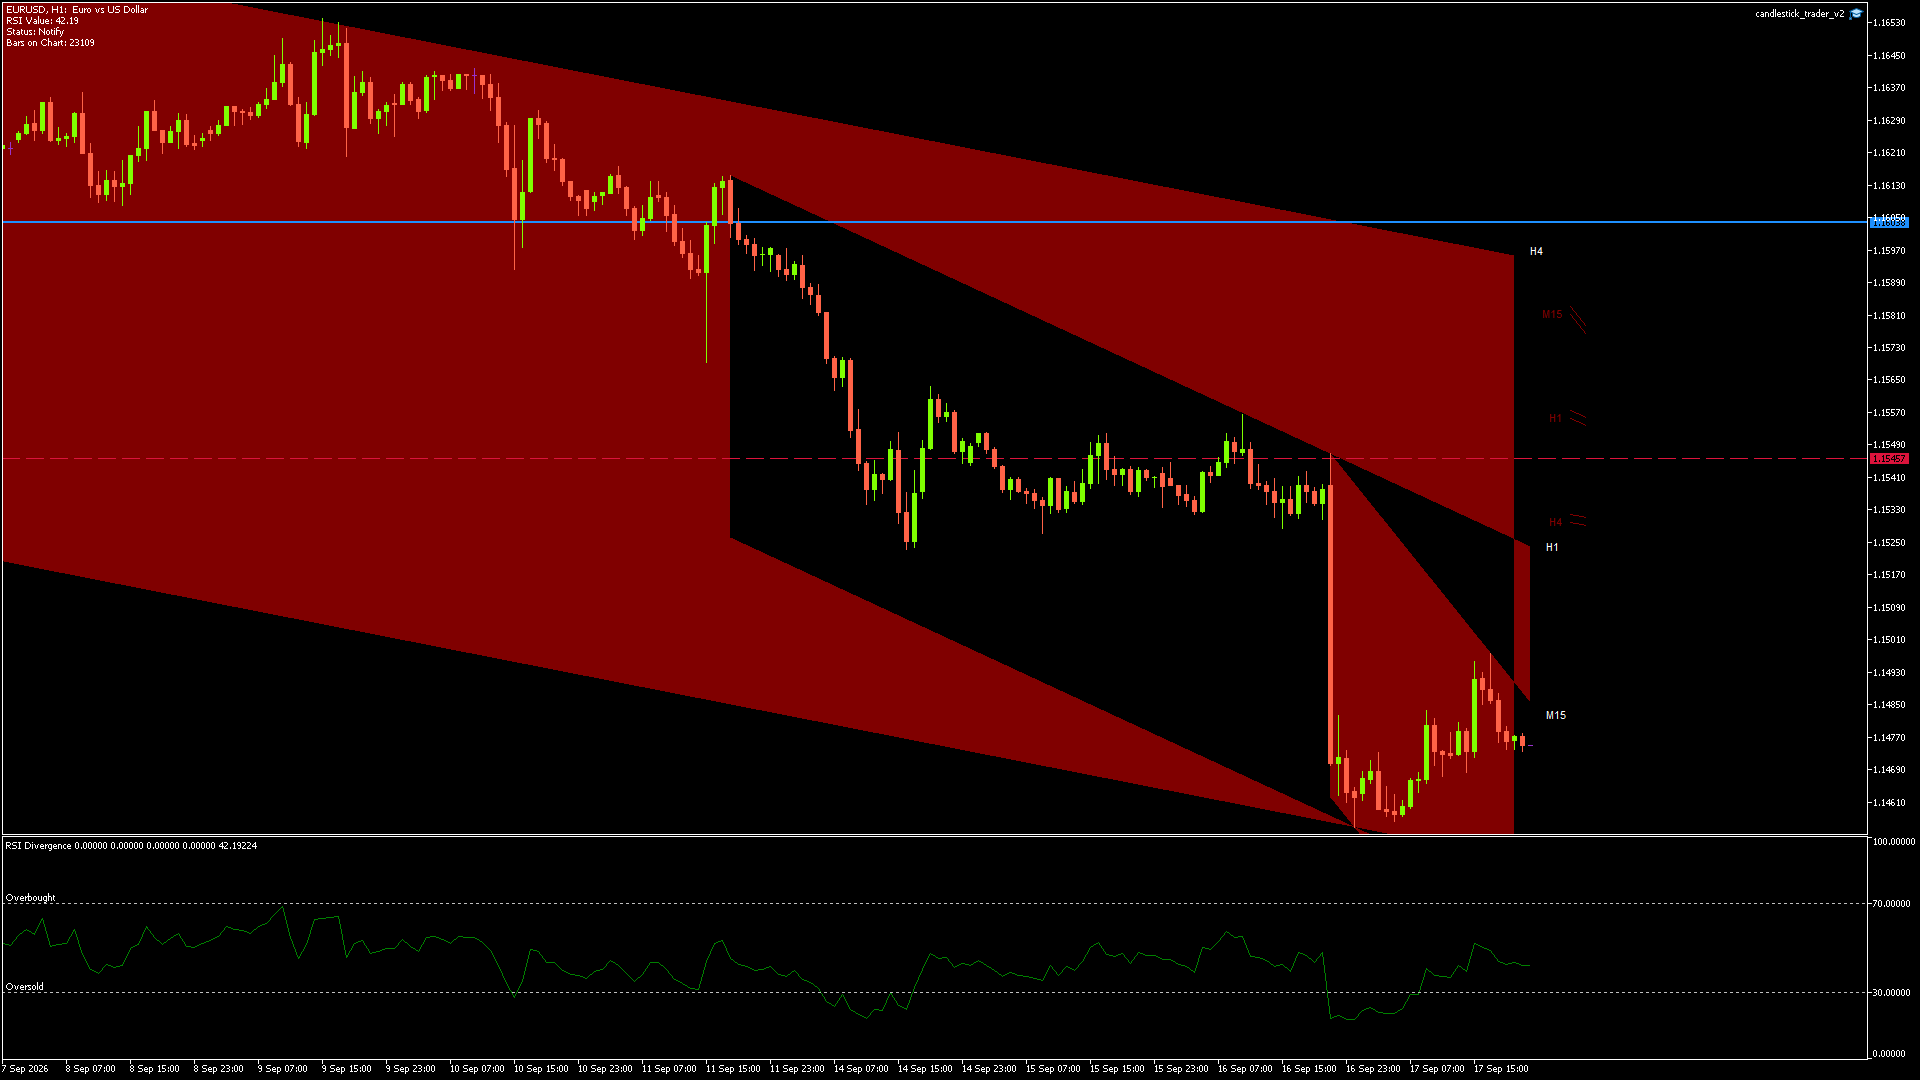
Current Market
Symbol
EURUSD
Date
17/09/202620:00:01
Price
1.14749
RSI
42.19
OversoldOverbought
Prev Open
1.14772
Prev High
1.14778
Prev Low
1.14734
Prev Close
1.14749
14-Day Range
Low 1.14579
Near 14-day low
High 1.16484
RSI Snapshot - 14 Days
46Average
0%Overbought
10%Oversold
33Percentile
RSI Divergence Watch
NO DIVERGENCE
No RSI divergence detected on the recent hourly data.
▼ Downtrend
1-day price -0.71% vs prior 3 days - RSI 42 and falling
Price & RSI History (14 days)
Hourly closes from our scanner archive.
▲ Buy setup▼ Sell setup
Analysis History
MEMBERS ONLY
New EURUSD analysis posted 11h ago
The latest analysis, with entry, stop loss and take profit levels, is available to members the moment it's published.
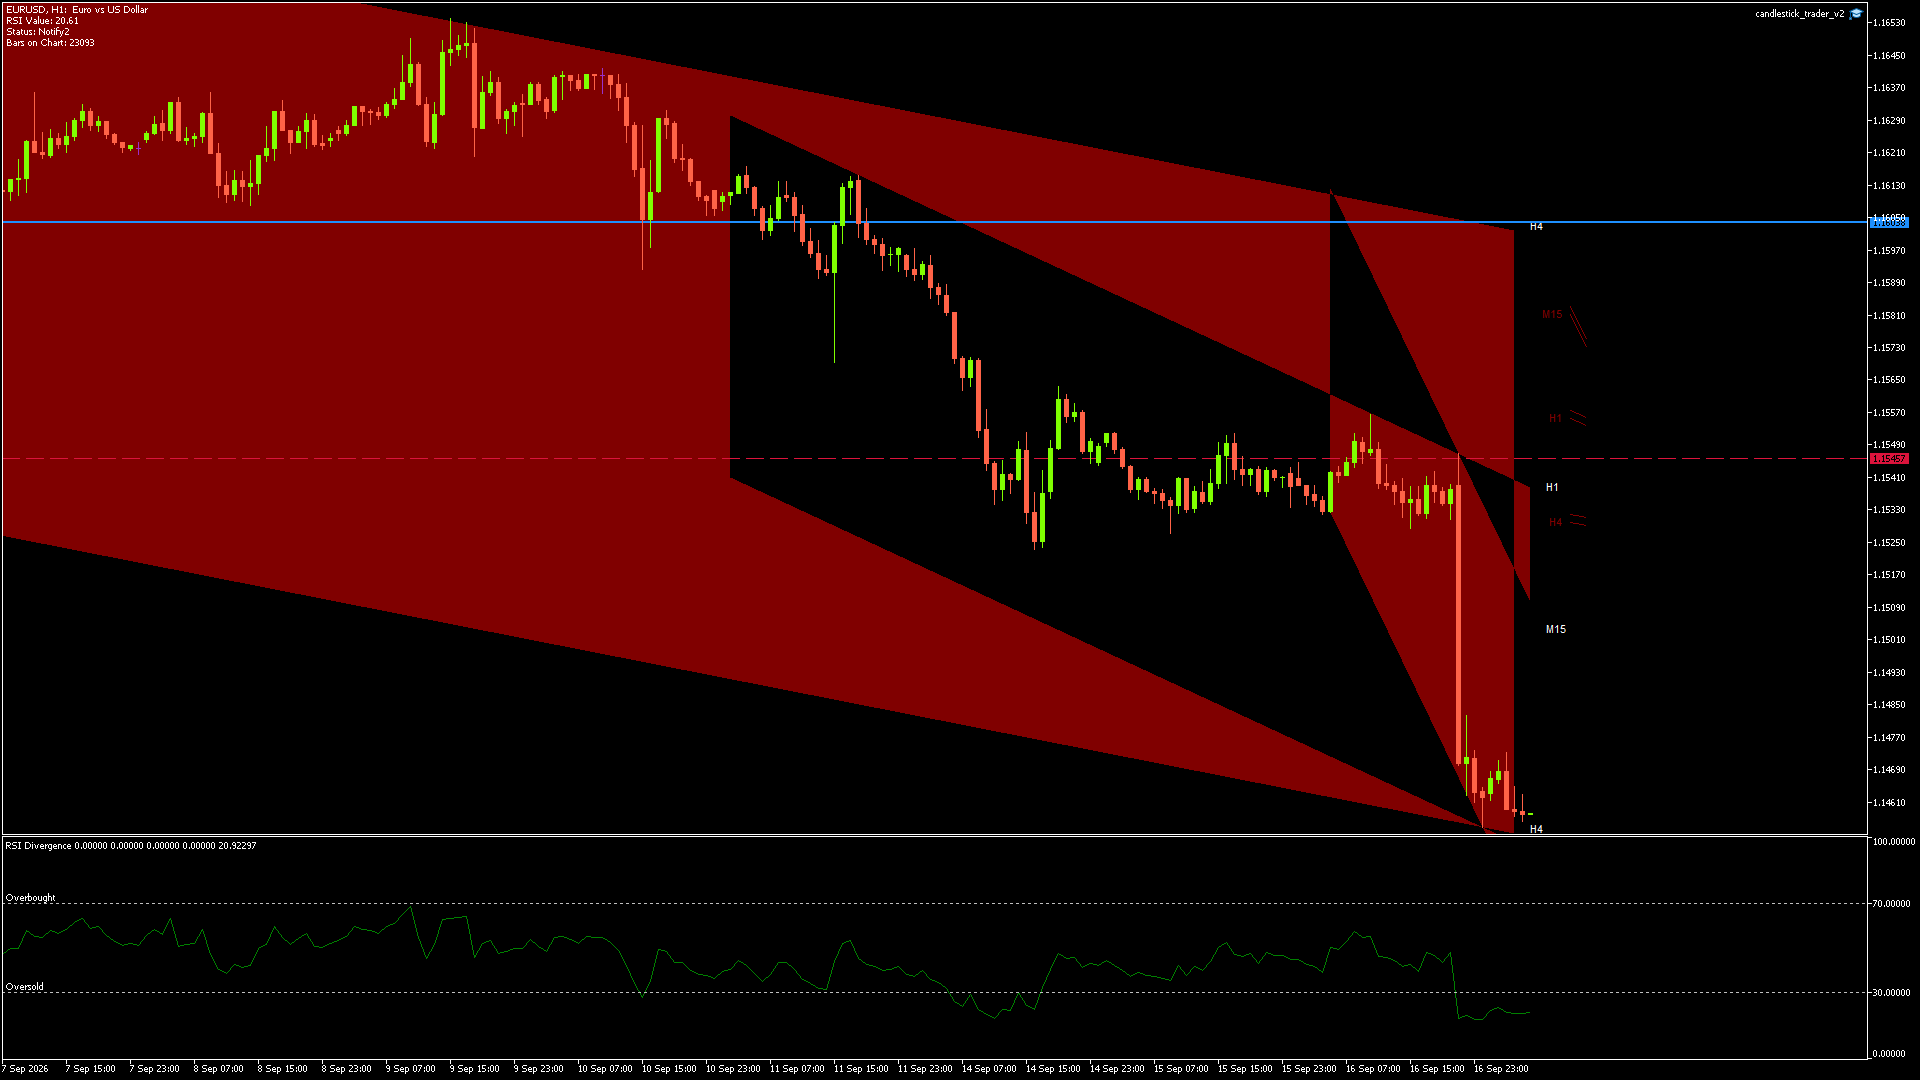
Analysis @ 17/09/2026 04:30:15 (172375)
NO TOP
NEUTRAL
Date/Time
17/09/2026 04:00:00
Price
1.14579
RSI
20.61
Prev Open
1.14586
Prev High
1.14629
Prev Low
1.14562
Prev Close
1.14579
Signal Type
Buy - Entry / SL / TP available to members - Sign Up
Confidence
4/10
1. SHOOTING STAR: No
2. HAMMER: No
3. RSI CONTEXT: oversold
4. CONFIDENCE: 4/10
5. OUTLOOK: NEUTRAL
6. SUMMARY: The previous CONTINUATION call did not play out; price sold off sharply instead. The current candle is a spinning top with notable wicks on both sides in oversold RSI, failing both shooting star and hammer criteria. Expect consolidation or a minor bounce risk while the broader downtrend remains unconfirmed for reversal.
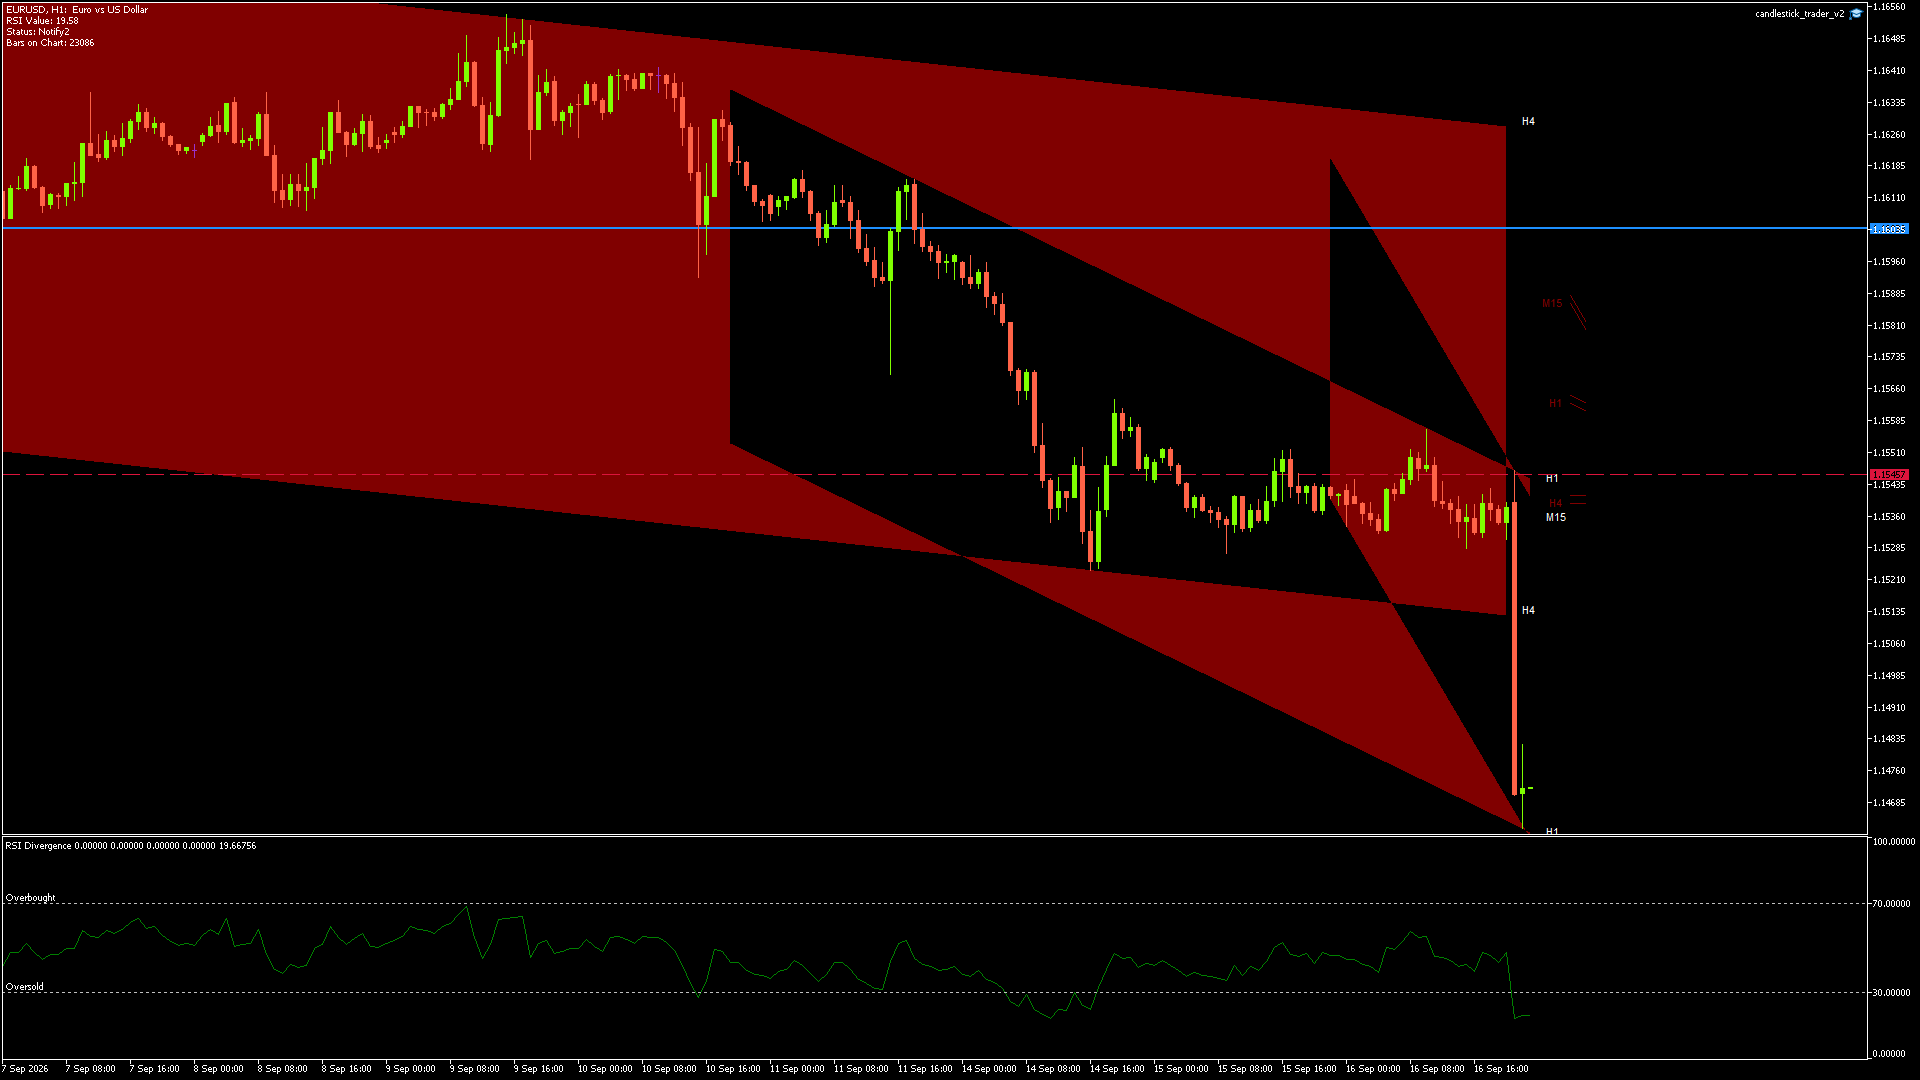
Analysis @ 16/09/2026 21:30:32 (172299)
NO TOP
CONTINUATION
Date/Time
16/09/2026 21:00:00
Price
1.14720
RSI
19.67
Prev Open
1.14706
Prev High
1.14823
Prev Low
1.14625
Prev Close
1.14719
Signal Type
Sell - Entry / SL / TP available to members - Sign Up
Confidence
4/10
1. SHOOTING STAR: No
2. HAMMER: No
3. RSI CONTEXT: oversold
4. CONFIDENCE: 4/10
5. OUTLOOK: CONTINUATION
6. SUMMARY: The prior CONTINUATION call did not play out; price reversed with a sharp selloff. Current candle is a spinning top in oversold RSI, so no valid shooting star or hammer; bias is for bearish continuation after any brief oversold pause.
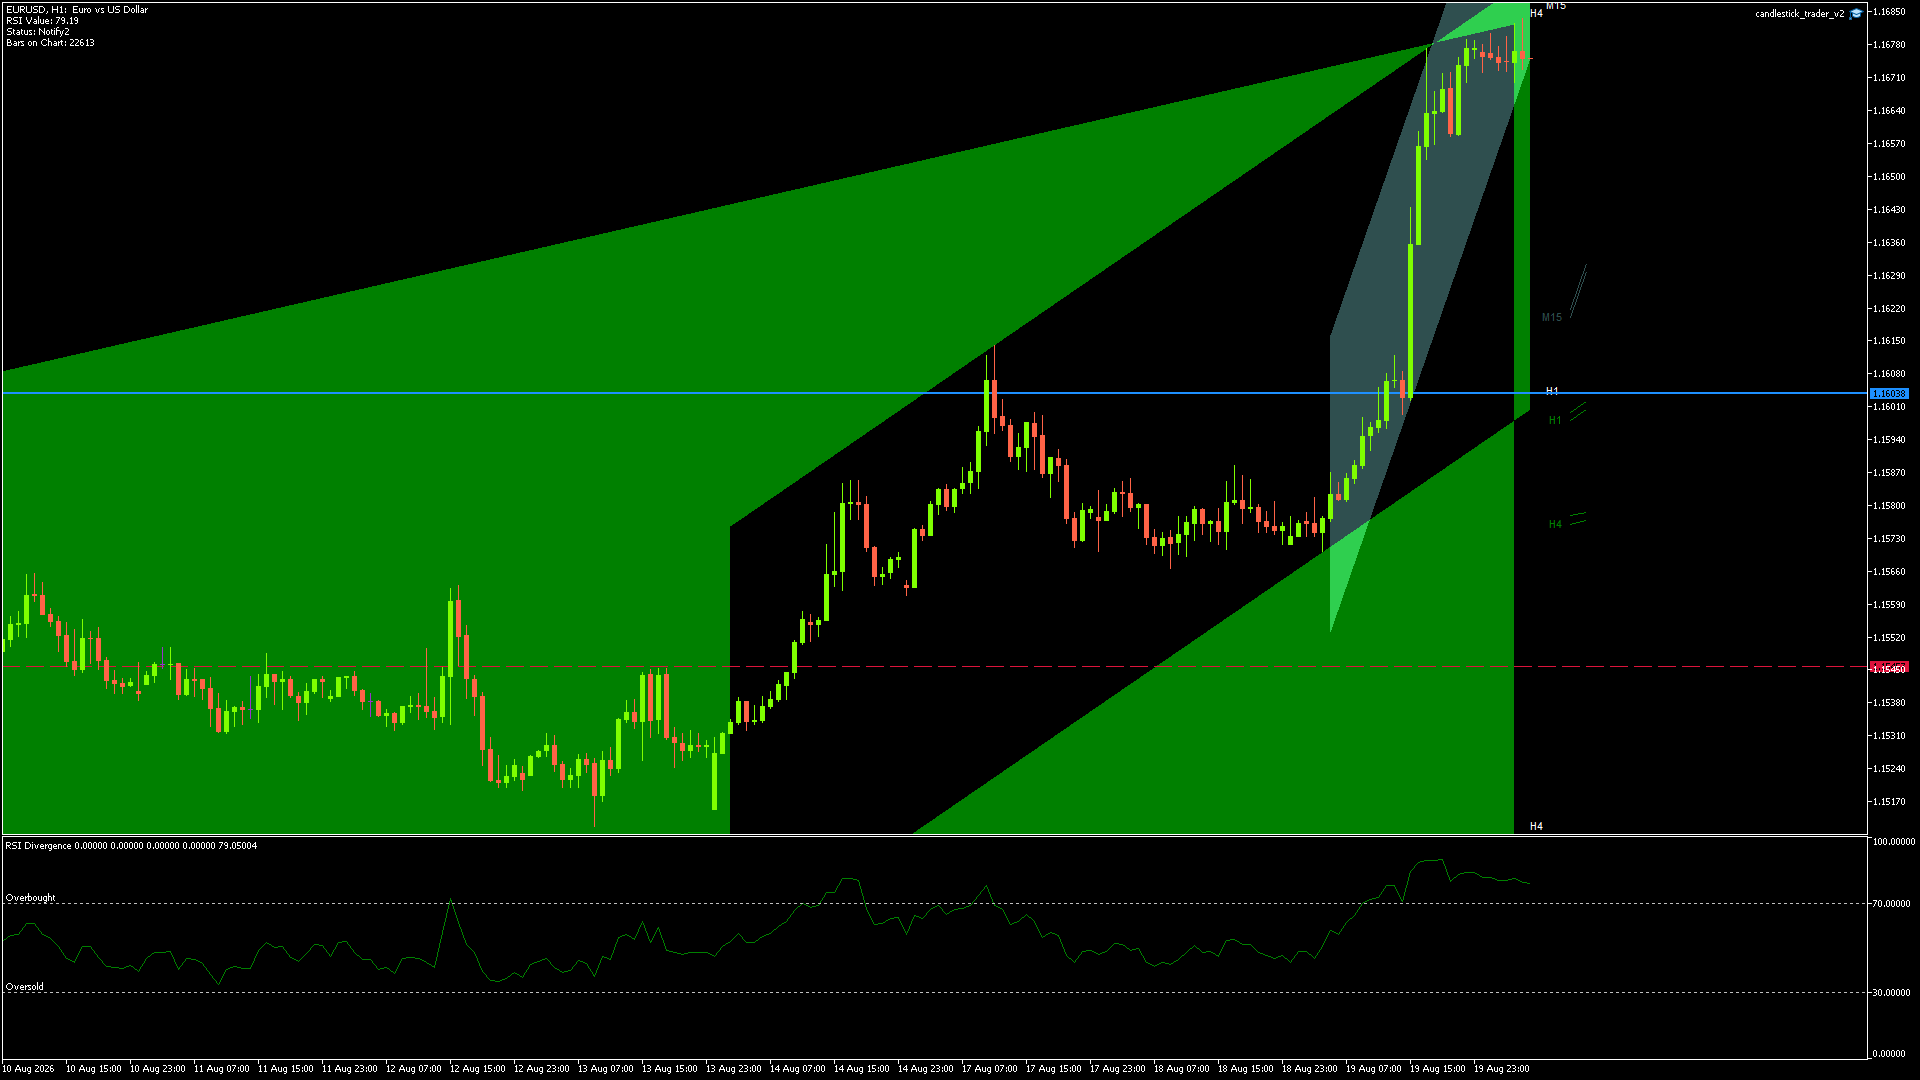
Analysis @ 20/08/2026 04:15:13 (167246)
NO TOP
CONTINUATION
Date/Time
20/08/2026 04:00:01
Price
1.16751
RSI
79.19
Prev Open
1.16766
Prev High
1.16835
Prev Low
1.16727
Prev Close
1.16751
Signal Type
Buy - Entry / SL / TP available to members - Sign Up
Confidence
4/10
1. SHOOTING STAR: No
2. HAMMER: No
3. RSI CONTEXT: overbought
4. CONFIDENCE: 4/10
5. OUTLOOK: CONTINUATION
6. SUMMARY: Yes—the previous continuation call played out with a sharp spike higher. The current candle is a spinning top with wicks on both sides (lower wick not minimal), so no valid shooting star or hammer; trend bias remains up but expect possible pause/pullback while overbought.
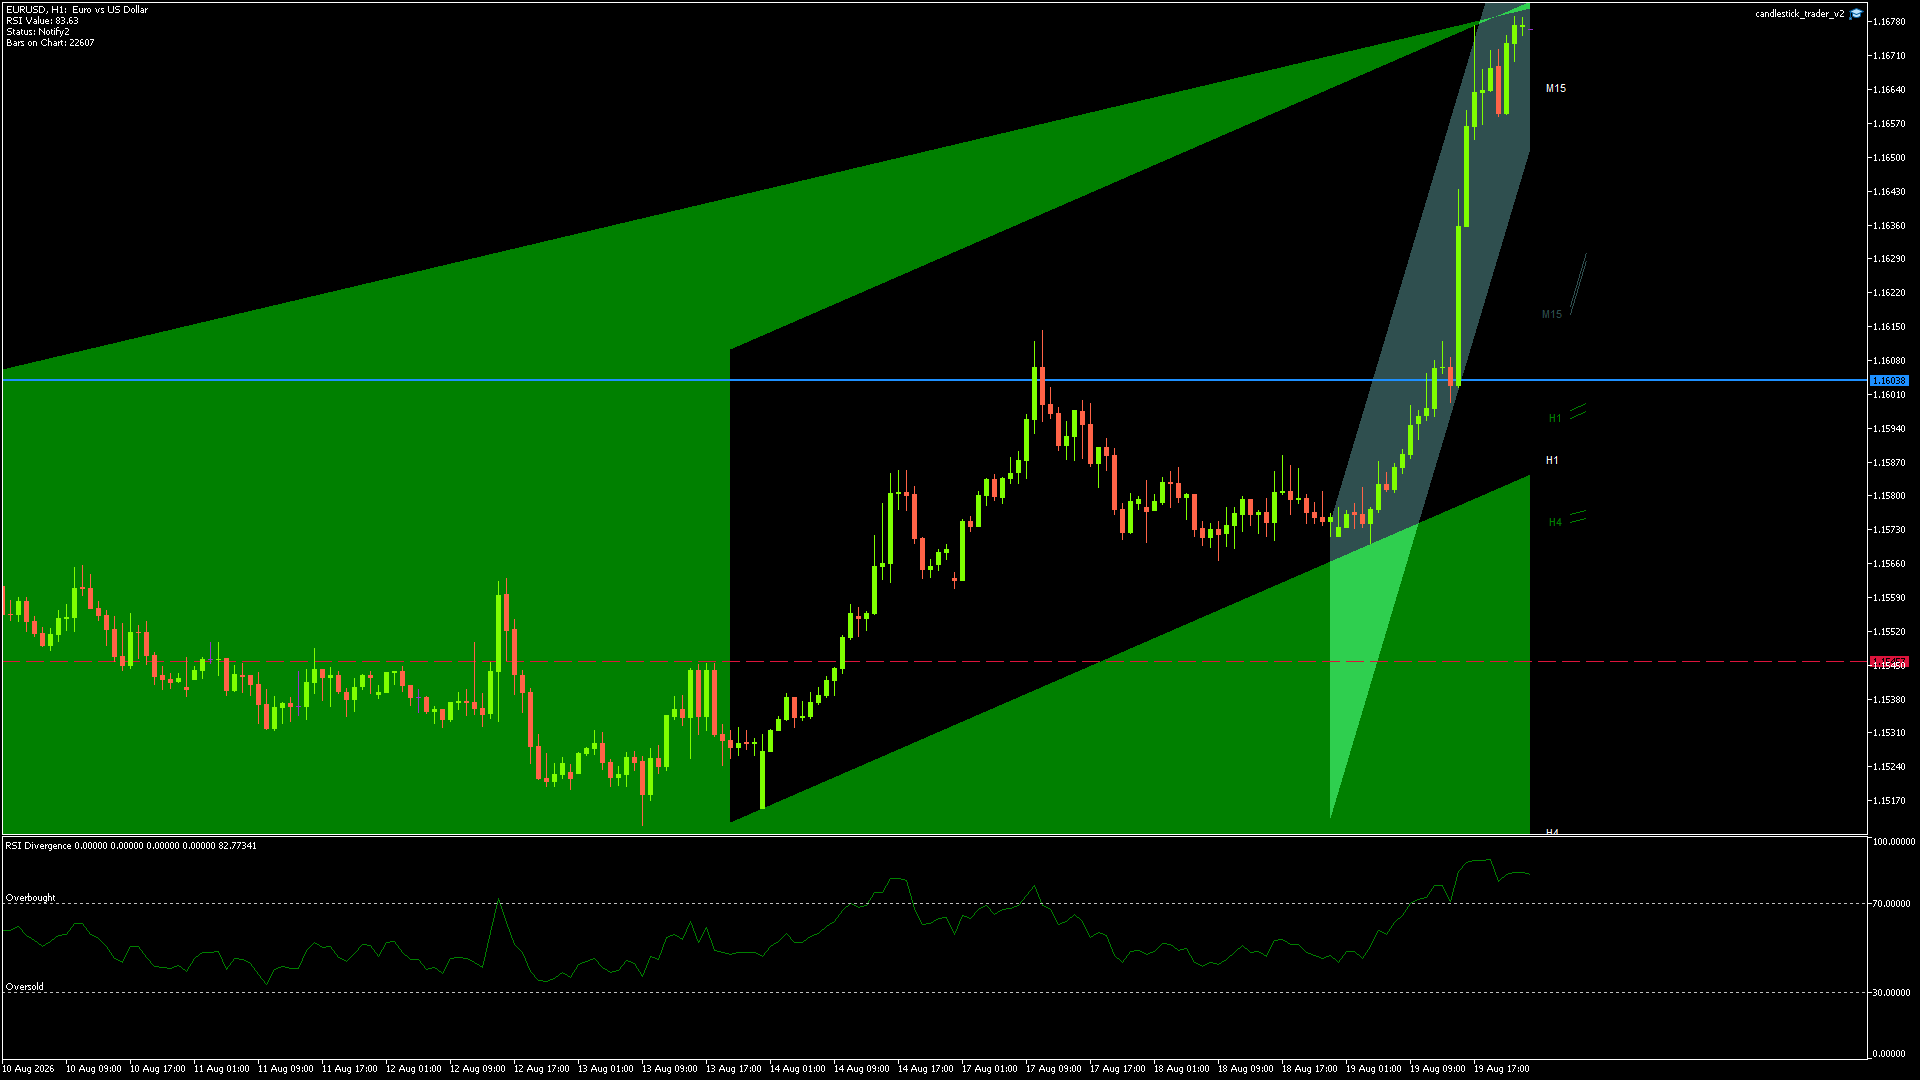
Analysis @ 19/08/2026 22:15:30 (167190)
NO TOP
CONTINUATION
Date/Time
19/08/2026 22:00:00
Price
1.16764
RSI
82.77
Prev Open
1.16771
Prev High
1.16789
Prev Low
1.16751
Prev Close
1.16772
Signal Type
Buy - Entry / SL / TP available to members - Sign Up
Confidence
4/10
1. SHOOTING STAR: No
2. HAMMER: No
3. RSI CONTEXT: overbought
4. CONFIDENCE: 4/10
5. OUTLOOK: CONTINUATION
6. SUMMARY: The prior continuation call played out as EURUSD spiked higher. The latest candle is a spinning top with long wicks on both sides—no valid shooting star or hammer—so the uptrend stands, though overbought RSI flags risk of a pause/pullback.