GBPUSD Candlestick Analysis & Signal History

Real-time Forex trading signals with RSI divergence, pattern detection and risk management levels for GBPUSD.

Learn how to trade these signals

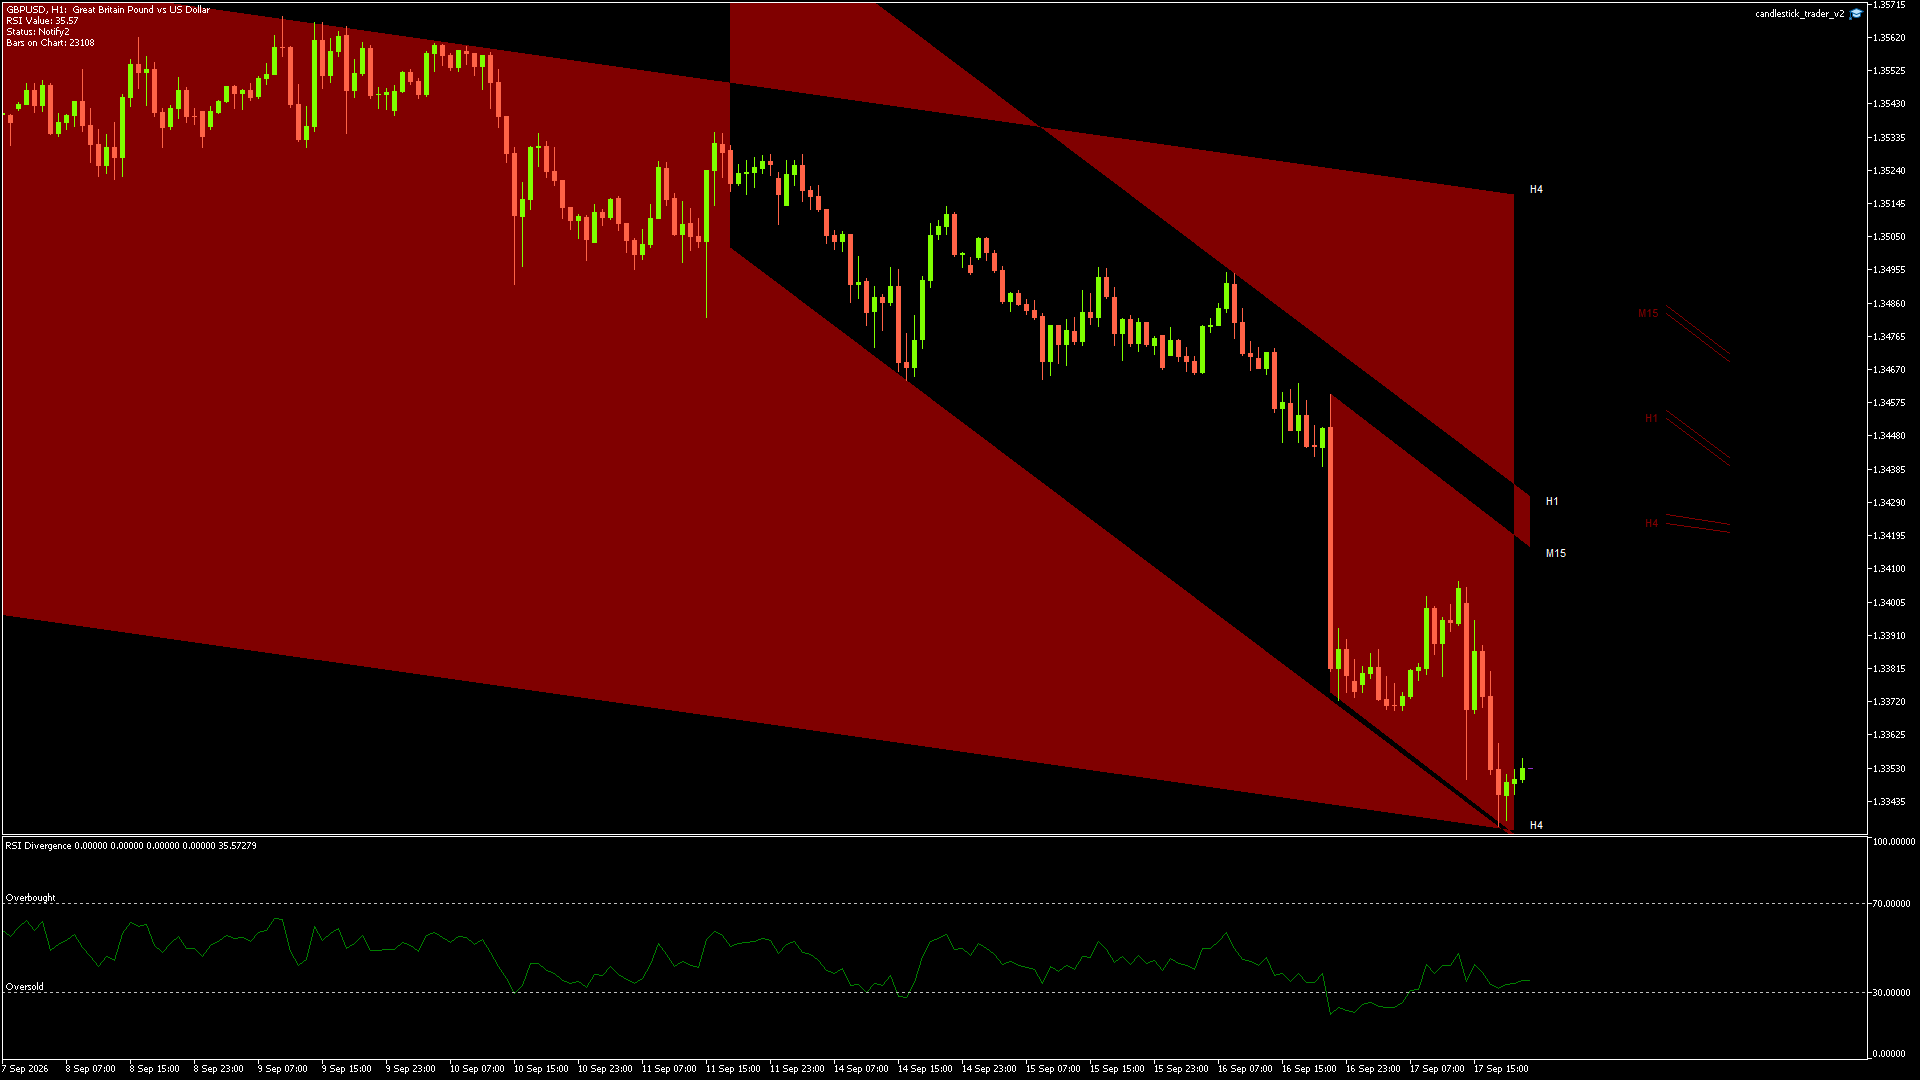
Current Market

GBPUSD candlestick chart showing current price action and technical levels

Current Market

Symbol
GBPUSD
Date
17/09/202620:00:00
Price
1.33528
RSI
35.57
OversoldOverbought
Prev Open
1.33498
Prev High
1.33558
Prev Low
1.33488
Prev Close
1.33528
14-Day Range
Low 1.33453 Near 14-day low High 1.35626
RSI Snapshot - 14 Days
47Average
0%Overbought
6%Oversold
15Percentile
RSI is unusually low vs the last 14 days - watch for a bounce
RSI Divergence Watch
NO DIVERGENCE
No RSI divergence detected on the recent hourly data.
▼ Downtrend 6-day price -0.57% vs prior 3 days - RSI 36 and falling

Price & RSI History (14 days)

1.35735 1.35137 1.3454 1.33942 1.33344 1.33528 70 30 17/09/2026 01:30 - Sell setup - Entry: 1.343 - SL: 1.344 16/09/2026 21:31 - Sell setup - Entry: 1.342 - SL: 1.343 14/09/2026 15:30 - Buy setup - Entry: 1.344 - SL: 1.3425 03 Sep 08 Sep 10 Sep 15 Sep 17 Sep

Hourly closes from our scanner archive.

▲ Buy setup▼ Sell setup

Analysis History

MEMBERS ONLY

New GBPUSD analysis posted 17h ago

The latest analysis, with entry, stop loss and take profit levels, is available to members the moment it's published.

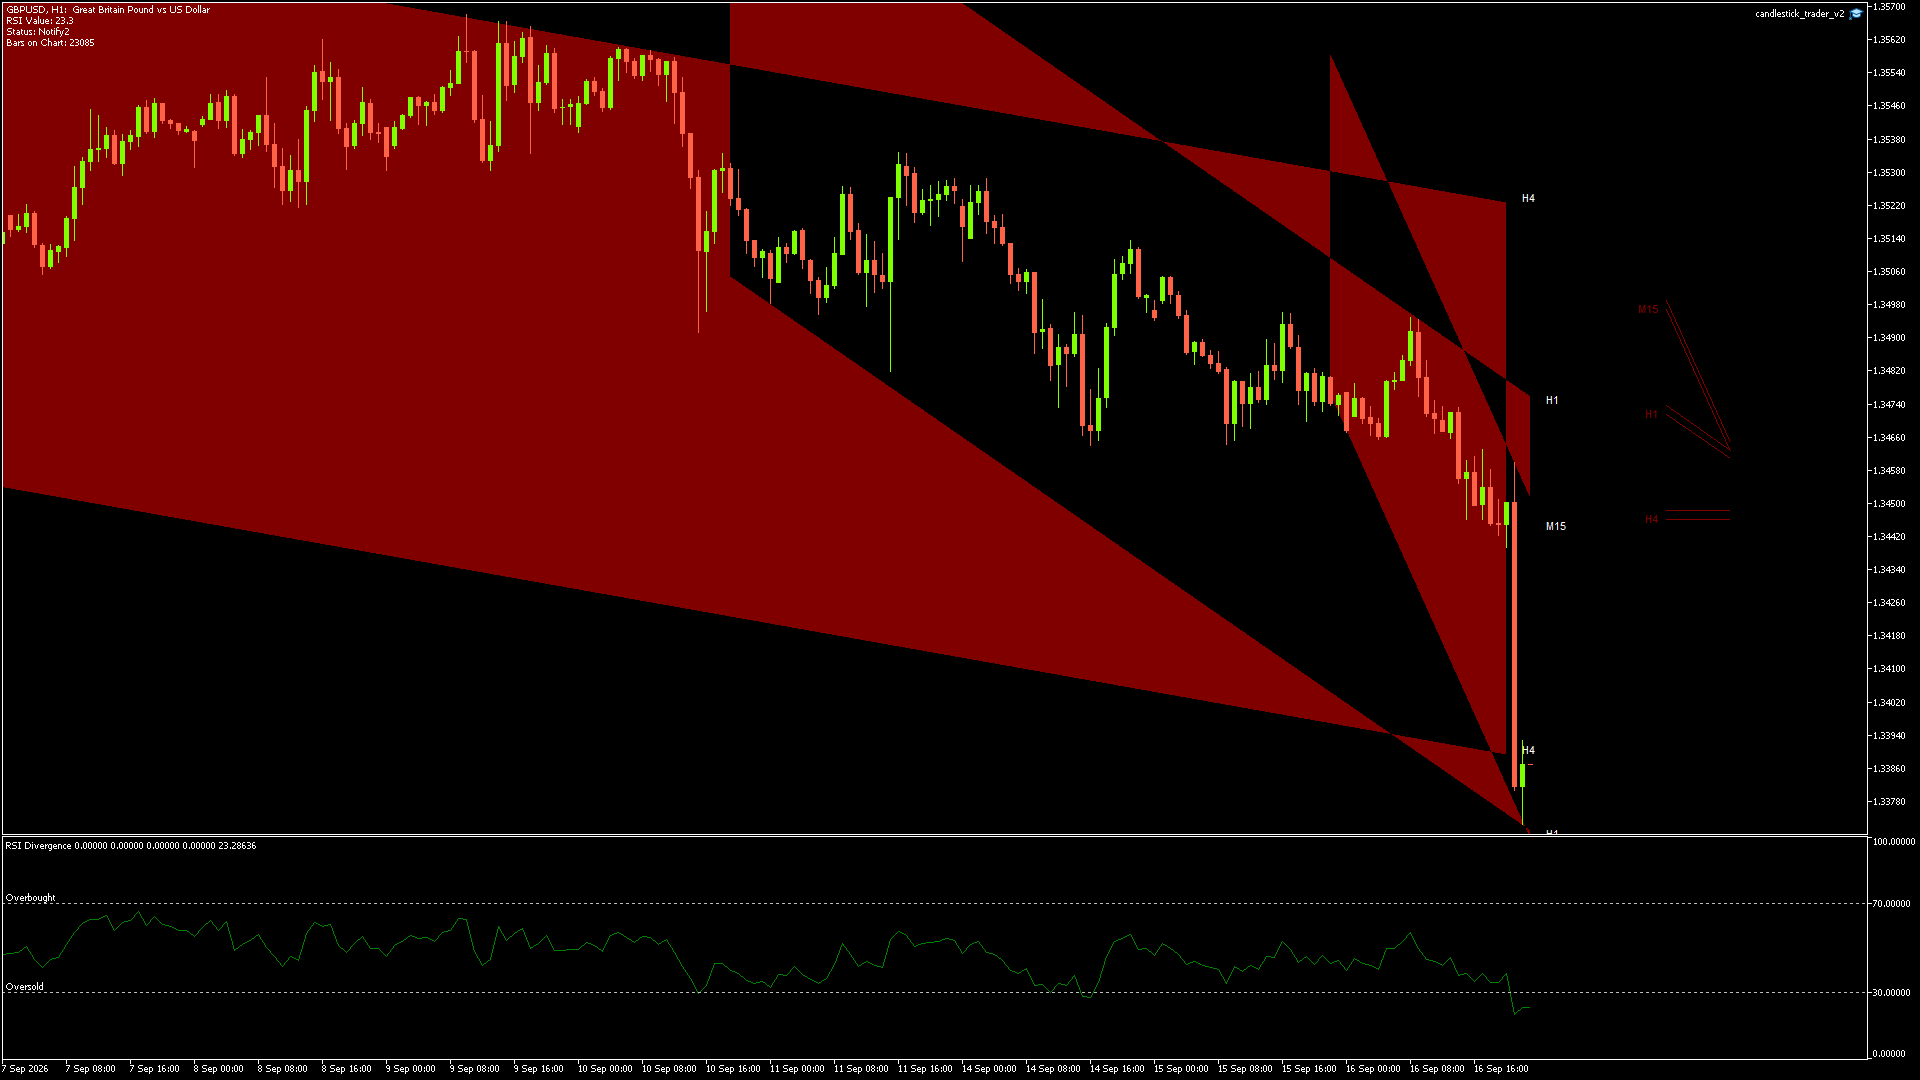
Analysis @ 16/09/2026 21:31:06 (172306)
NO TOP CONTINUATION
Date/Time
16/09/2026 21:00:02
Price
1.33868
RSI
23.29
Prev Open
1.33816
Prev High
1.33928
Prev Low
1.33723
Prev Close
1.33869
Signal Type
Sell - Entry / SL / TP available to members - Sign Up
Confidence
6/10
GBPUSD candlestick chart showing current price action and technical levels

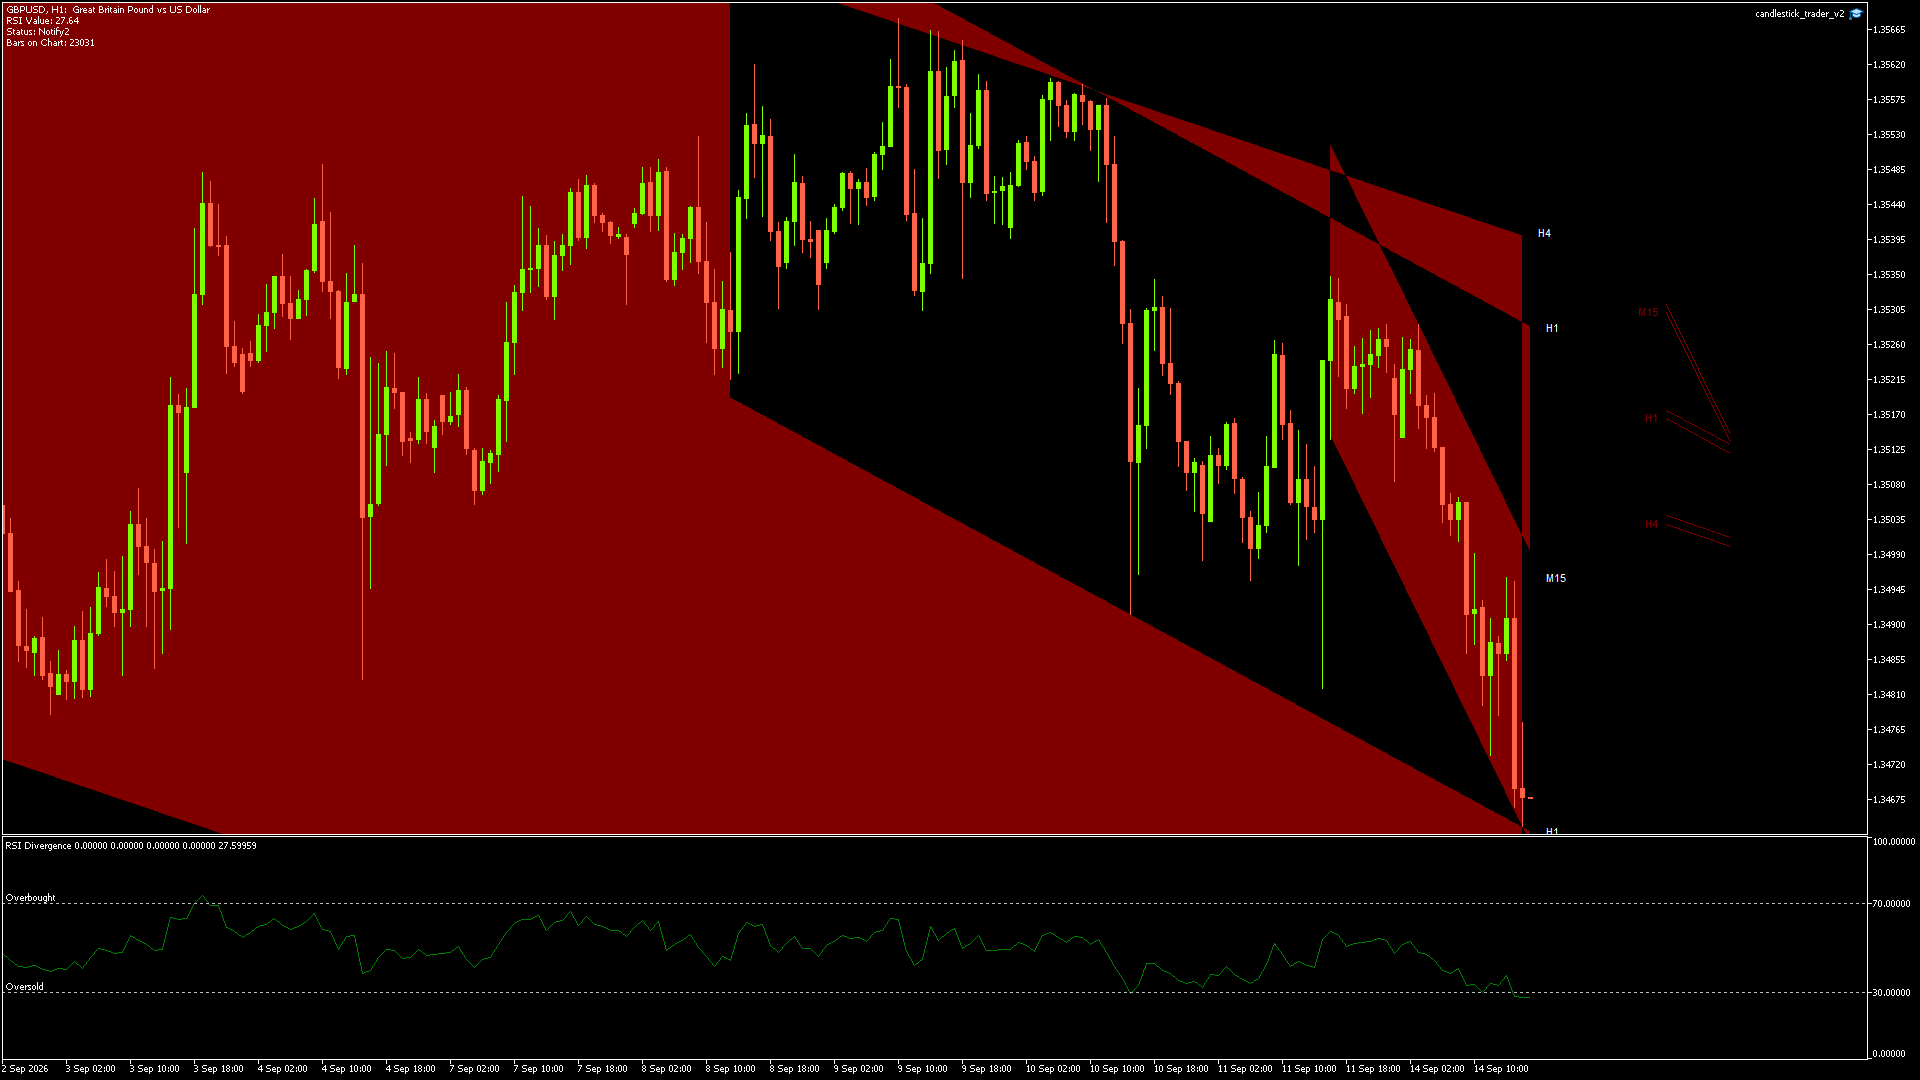
Analysis @ 14/09/2026 15:30:27 (171716)
NO TOP NEUTRAL
Date/Time
14/09/2026 15:00:00
Price
1.34676
RSI
27.60
Prev Open
1.34689
Prev High
1.34774
Prev Low
1.34640
Prev Close
1.34677
Signal Type
Buy - Entry / SL / TP available to members - Sign Up
Confidence
5/10
GBPUSD candlestick chart showing current price action and technical levels

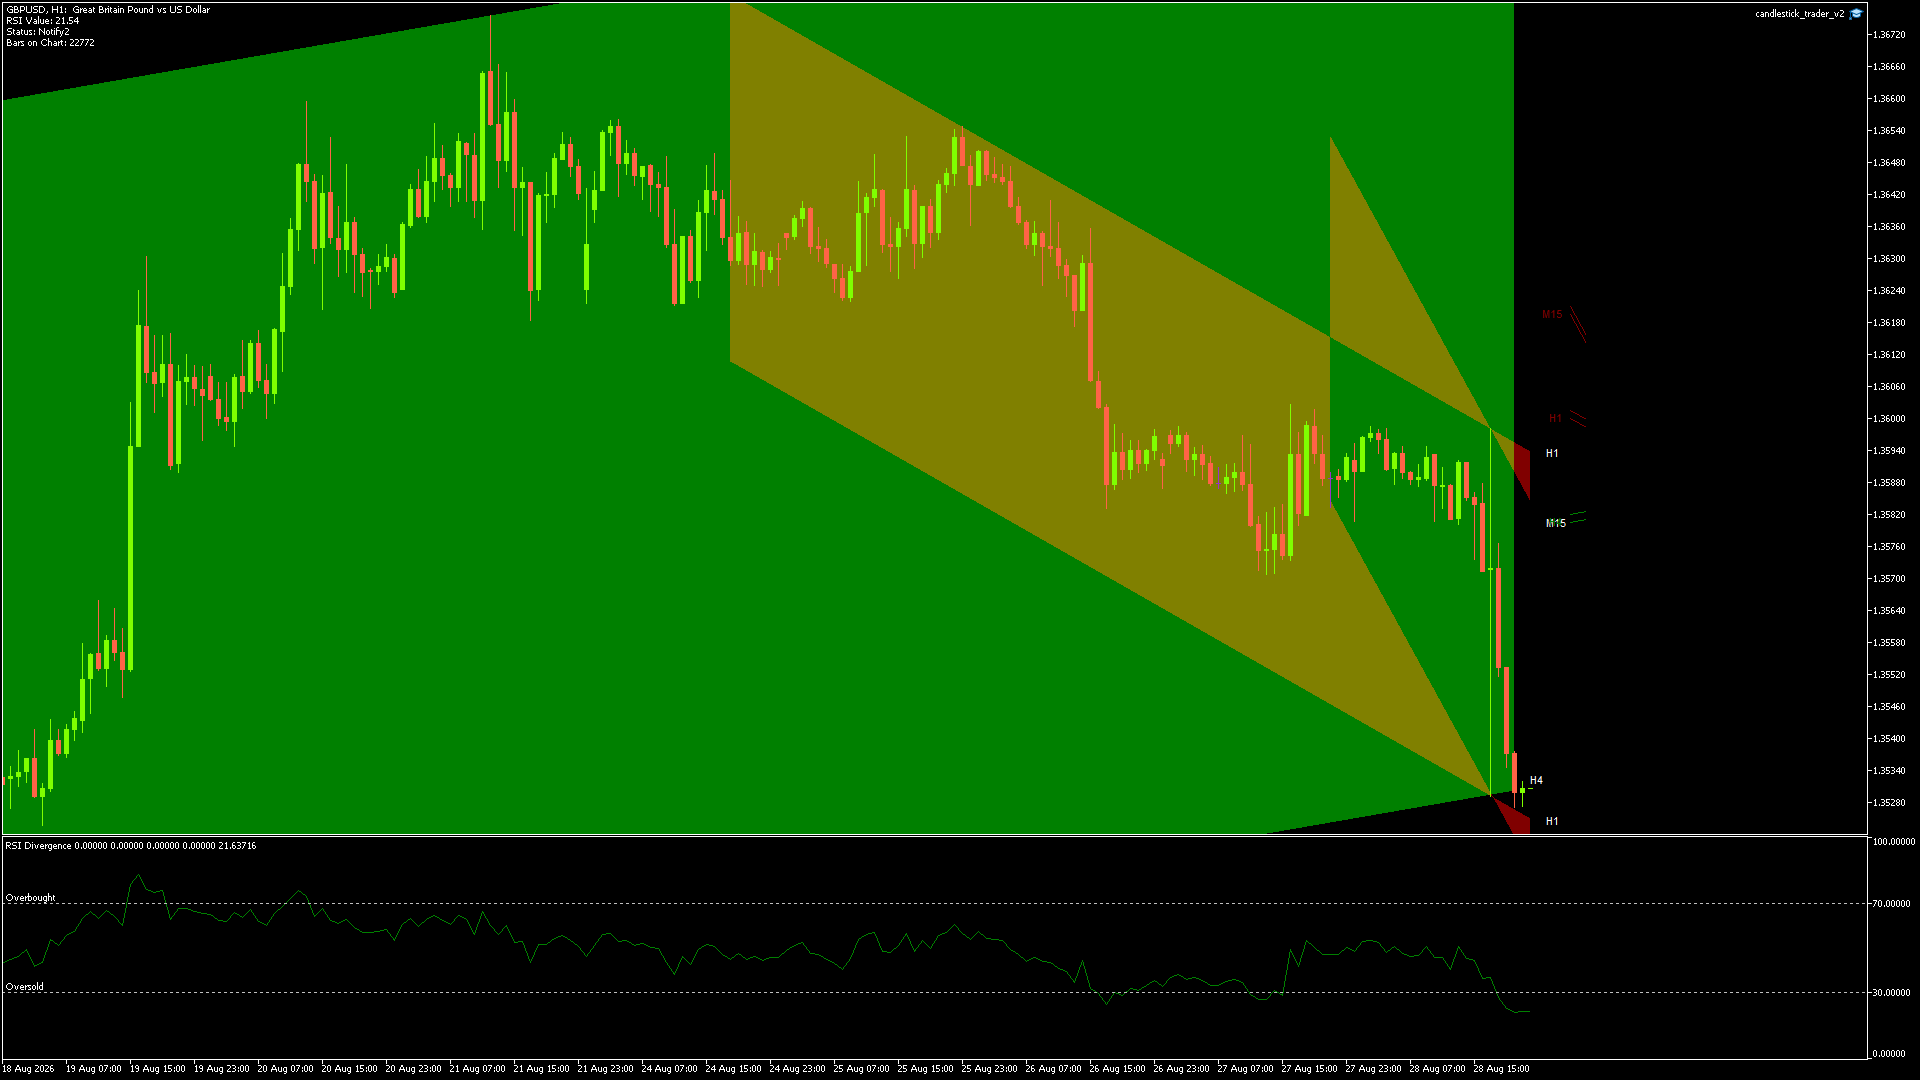
Analysis @ 28/08/2026 22:12:07 (168952)
NO TOP BULLISH
Date/Time
28/08/2026 20:00:01
Price
1.35307
RSI
21.64
Prev Open
1.35299
Prev High
1.35319
Prev Low
1.35272
Prev Close
1.35306
Signal Type
Buy - Entry / SL / TP available to members - Sign Up
Confidence
5/10
GBPUSD candlestick chart showing current price action and technical levels

1. SHOOTING STAR: No
2. HAMMER: Weak
3. RSI CONTEXT: oversold
4. CONFIDENCE: 5/10
5. OUTLOOK: BULLISH
6. SUMMARY: The latest bar is a small-bodied spin/weak hammer with a lower wick >3x the body at channel support, with RSI oversold. The prior neutral call did not catch the slide; price extended lower to support, and now a modest rebound is favored unless the new low breaks.
Analysis @ 27/08/2026 21:20:44 (168610)
NO TOP NEUTRAL
Date/Time
27/08/2026 12:00:01
Price
1.35755
RSI
27.04
Prev Open
1.35753
Prev High
1.35823
Prev Low
1.35708
Prev Close
1.35755
Signal Type
Buy - Entry / SL / TP available to members - Sign Up
Confidence
4/10
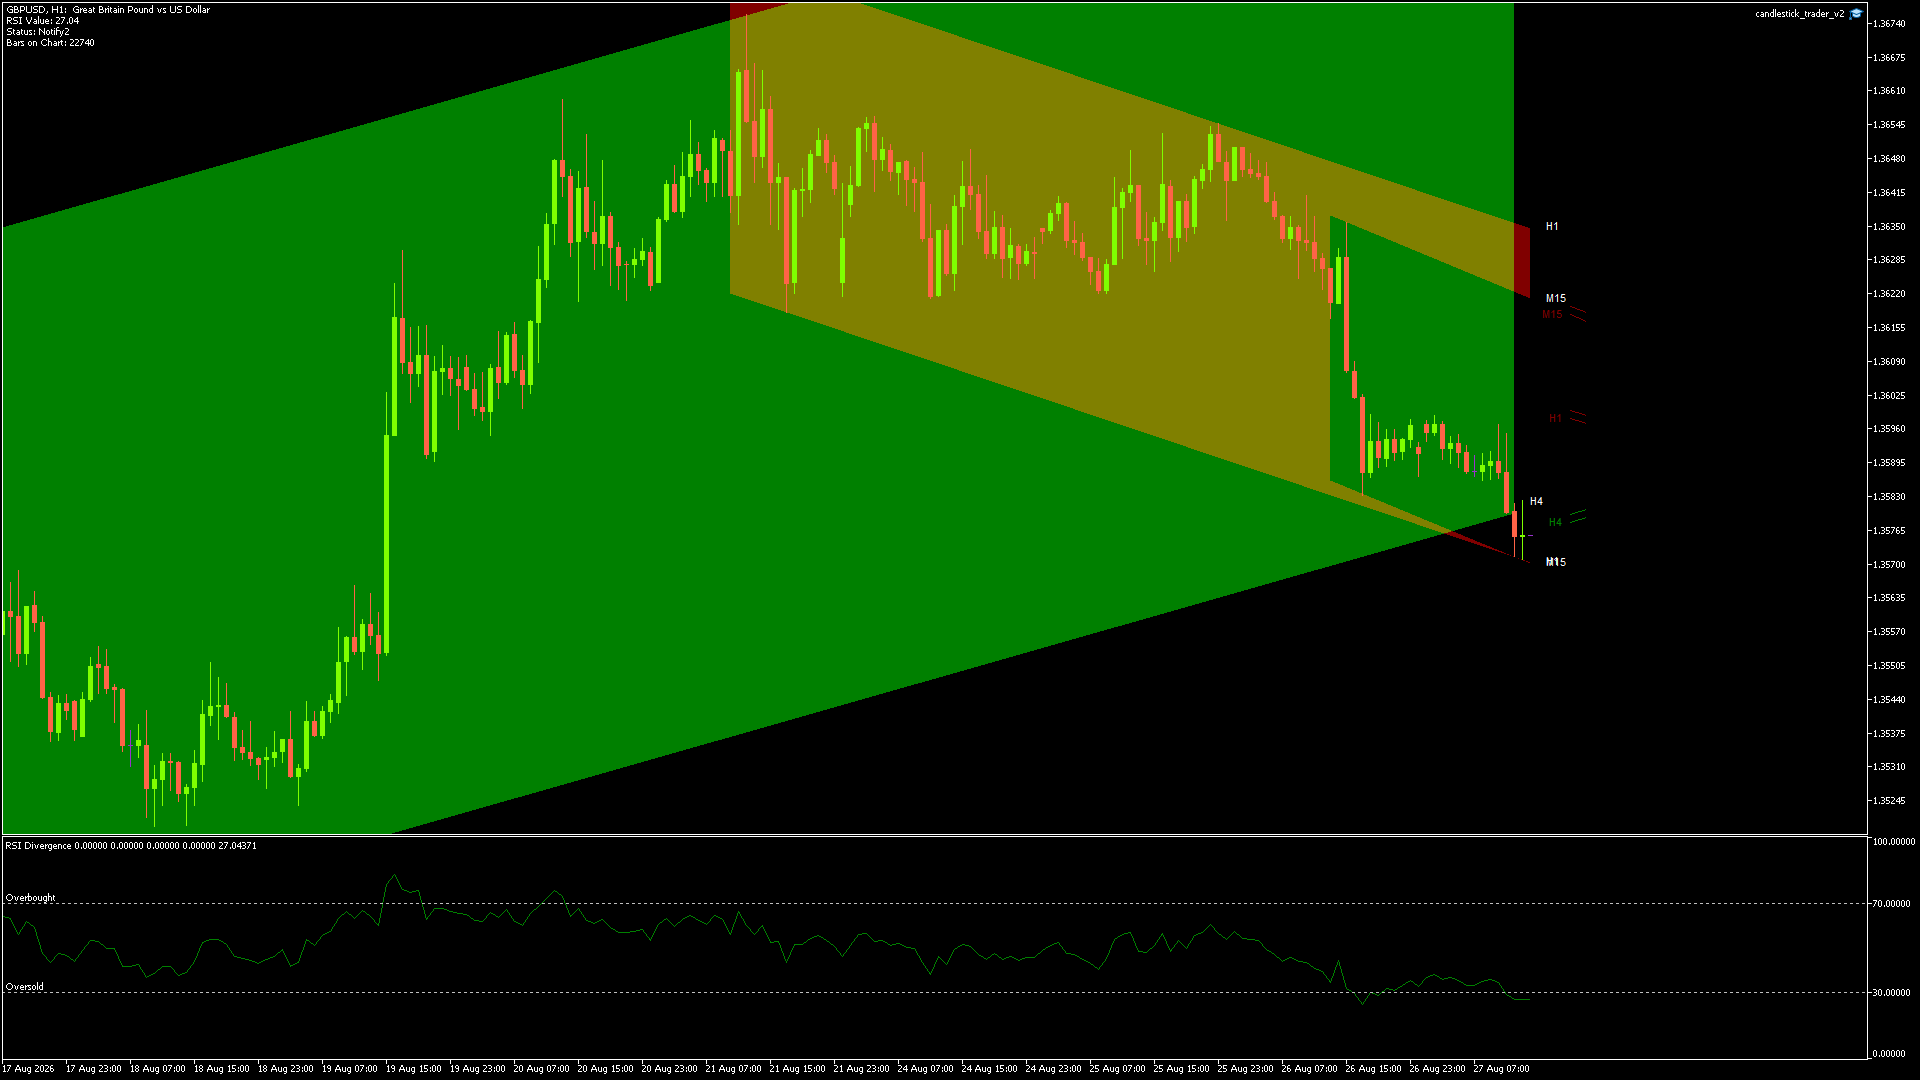
GBPUSD candlestick chart showing current price action and technical levels

1. SHOOTING STAR: No
2. HAMMER: No
3. RSI CONTEXT: oversold
4. CONFIDENCE: 4/10
5. OUTLOOK: NEUTRAL
6. SUMMARY: Yes—the earlier continuation view had played out; the later neutral/weak-SS idea didn’t confirm and price instead slid to channel support, pushing RSI oversold. The latest candle is a spinning top with long wicks both sides, so no valid reversal signal—stay neutral and wait for confirmation.

GBPUSD Candlestick Pattern Analysis & Trading Signals

This page displays the complete candlestick pattern analysis and trading signal history for GBPUSD. Our automated detection engine continuously monitors GBPUSD price action across multiple timeframes, identifying high-probability setups including spinning tops, hammer patterns, engulfing candles and RSI divergence formations.

Each analysis entry shows the exact technical conditions at the moment of detection. The chart screenshots capture the candlestick structure, RSI reading, and price level that combined to trigger a valid signal. This transparency allows you to verify our methodology and build confidence in the detection process before committing capital to any trade setup.

Understanding the GBPUSD Signal Data

The Current Market card displays the latest GBPUSD price, RSI level, and recent open, high, low and close values. When RSI moves above 70, the market is considered overbought and potential bearish reversal signals carry higher weight. When RSI drops below 30, oversold conditions suggest bullish reversal patterns may be more reliable. Our system uses these momentum thresholds to filter low-probability setups and surface only the most actionable opportunities.

The Analysis History section below shows every past detection for GBPUSD, including the signal type (Buy or Sell), confidence score, entry price, stop-loss level and take-profit target. Spinning top detections are highlighted with an orange border - these indecision patterns often precede significant trend changes when they form at key support or resistance levels. High-confidence entries (score 7 or above) are marked with a green border for quick visual identification.

How to Trade GBPUSD With Our Signals

Every GBPUSD alert includes precise entry points and stop-loss levels derived from the technical structure visible on the chart. The entry price typically aligns with the breakout or reversal confirmation level, while the stop-loss is placed beyond the recent swing high or low to avoid noise. This systematic approach to risk management ensures you always know your maximum exposure before entering a position.

For Forex traders focusing on GBPUSD, these candlestick signals provide the timing precision needed to capture moves without spending hours watching charts. Bookmark this page to monitor ongoing GBPUSD developments, or sign up for instant alerts to receive notifications the moment new patterns are detected across your watchlist.