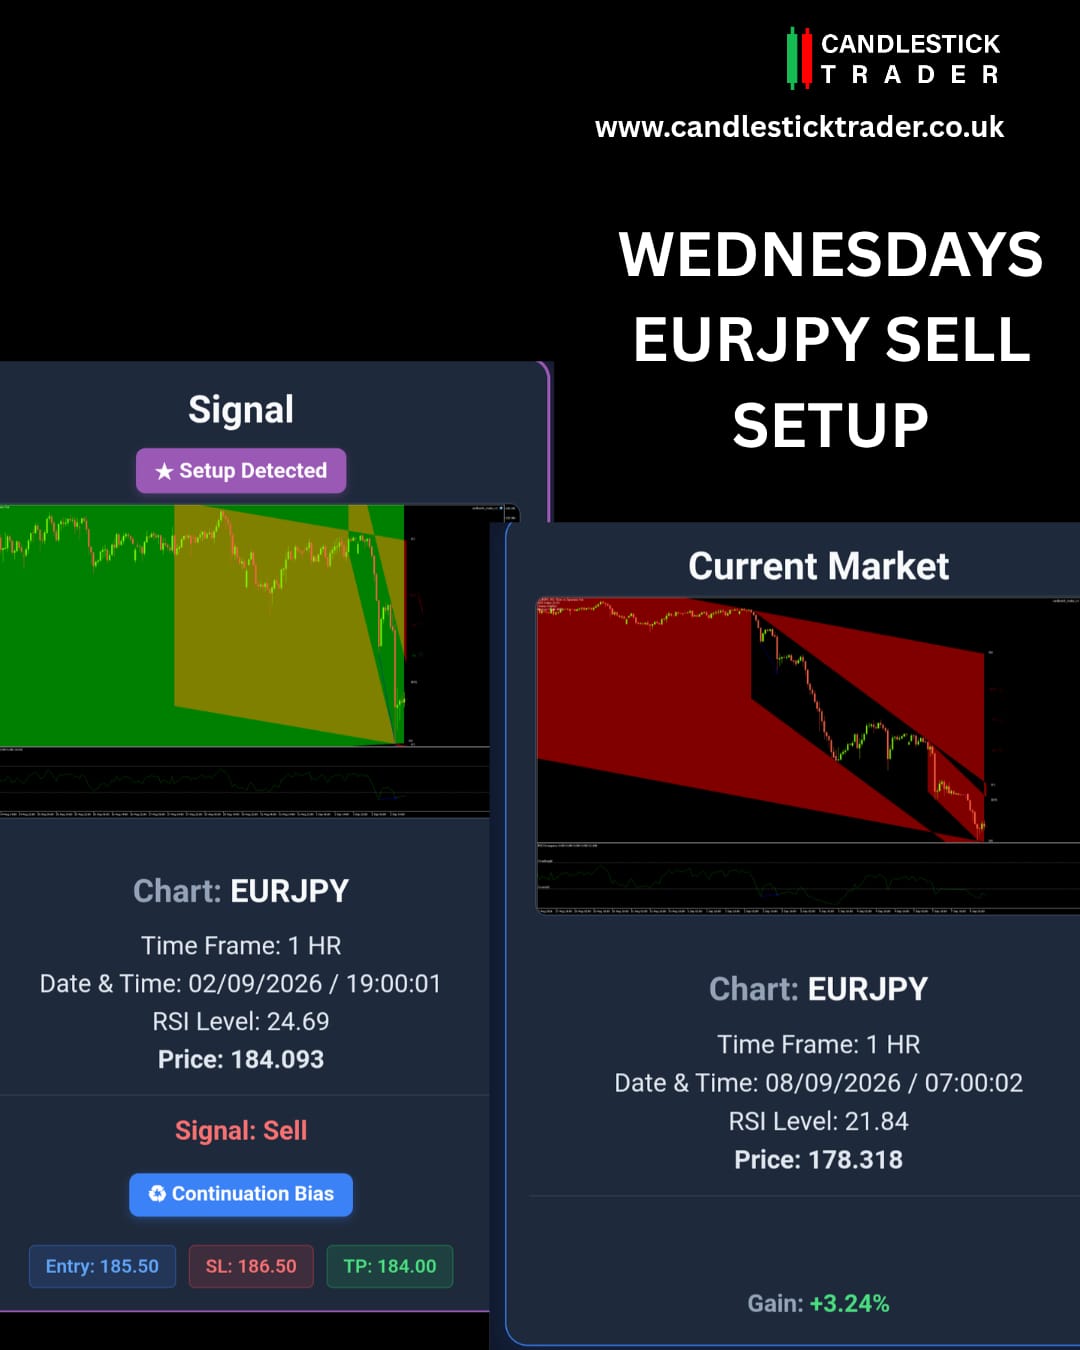
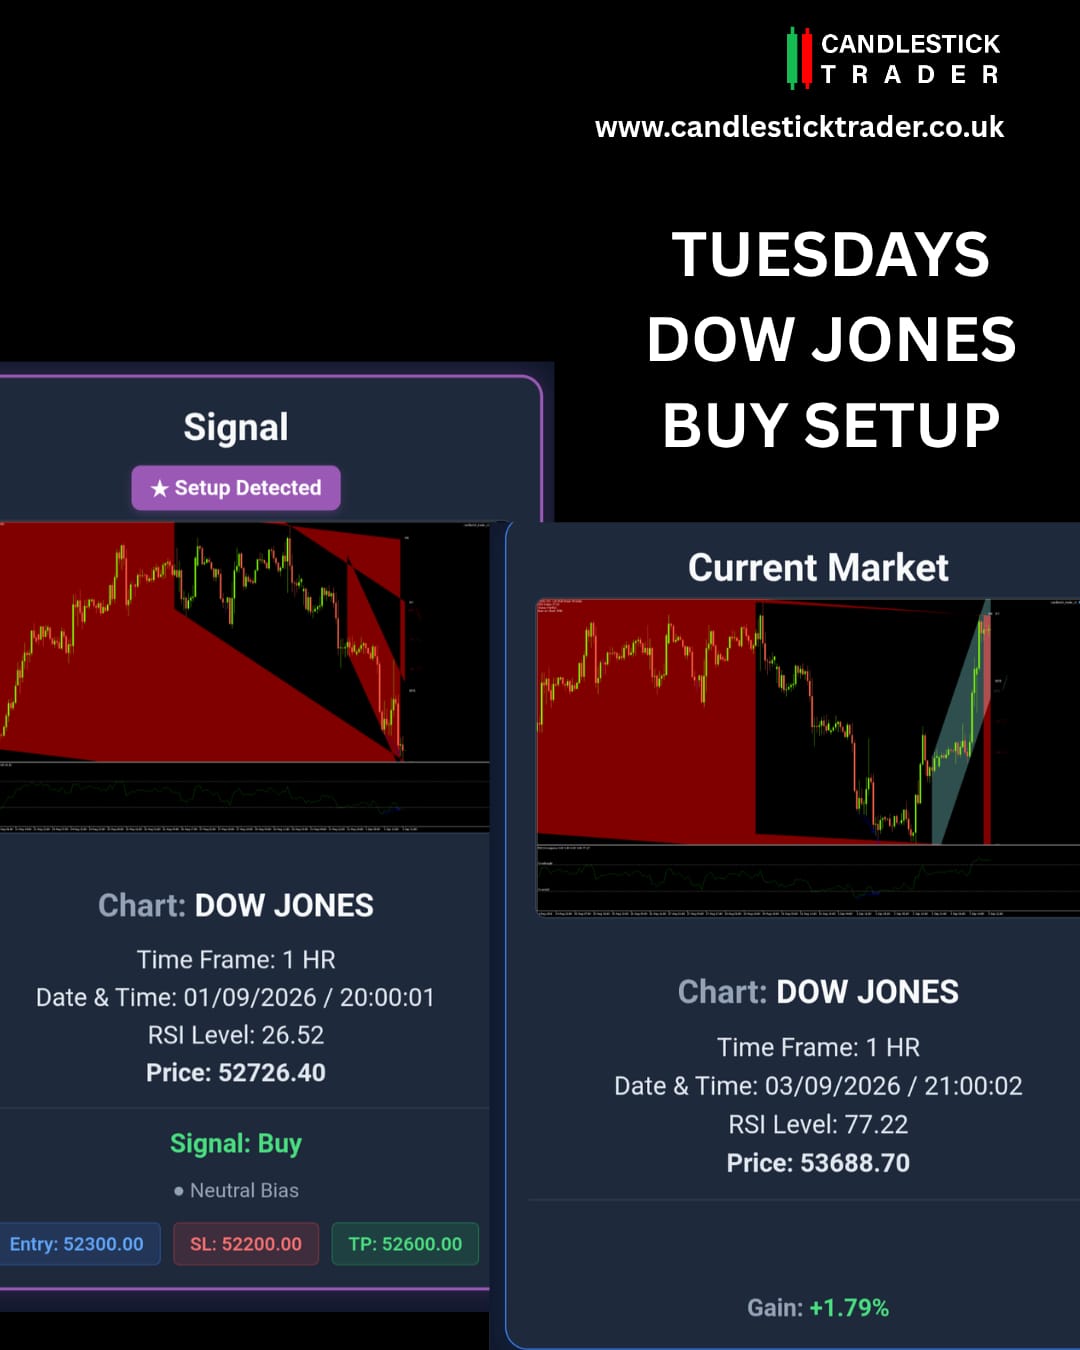
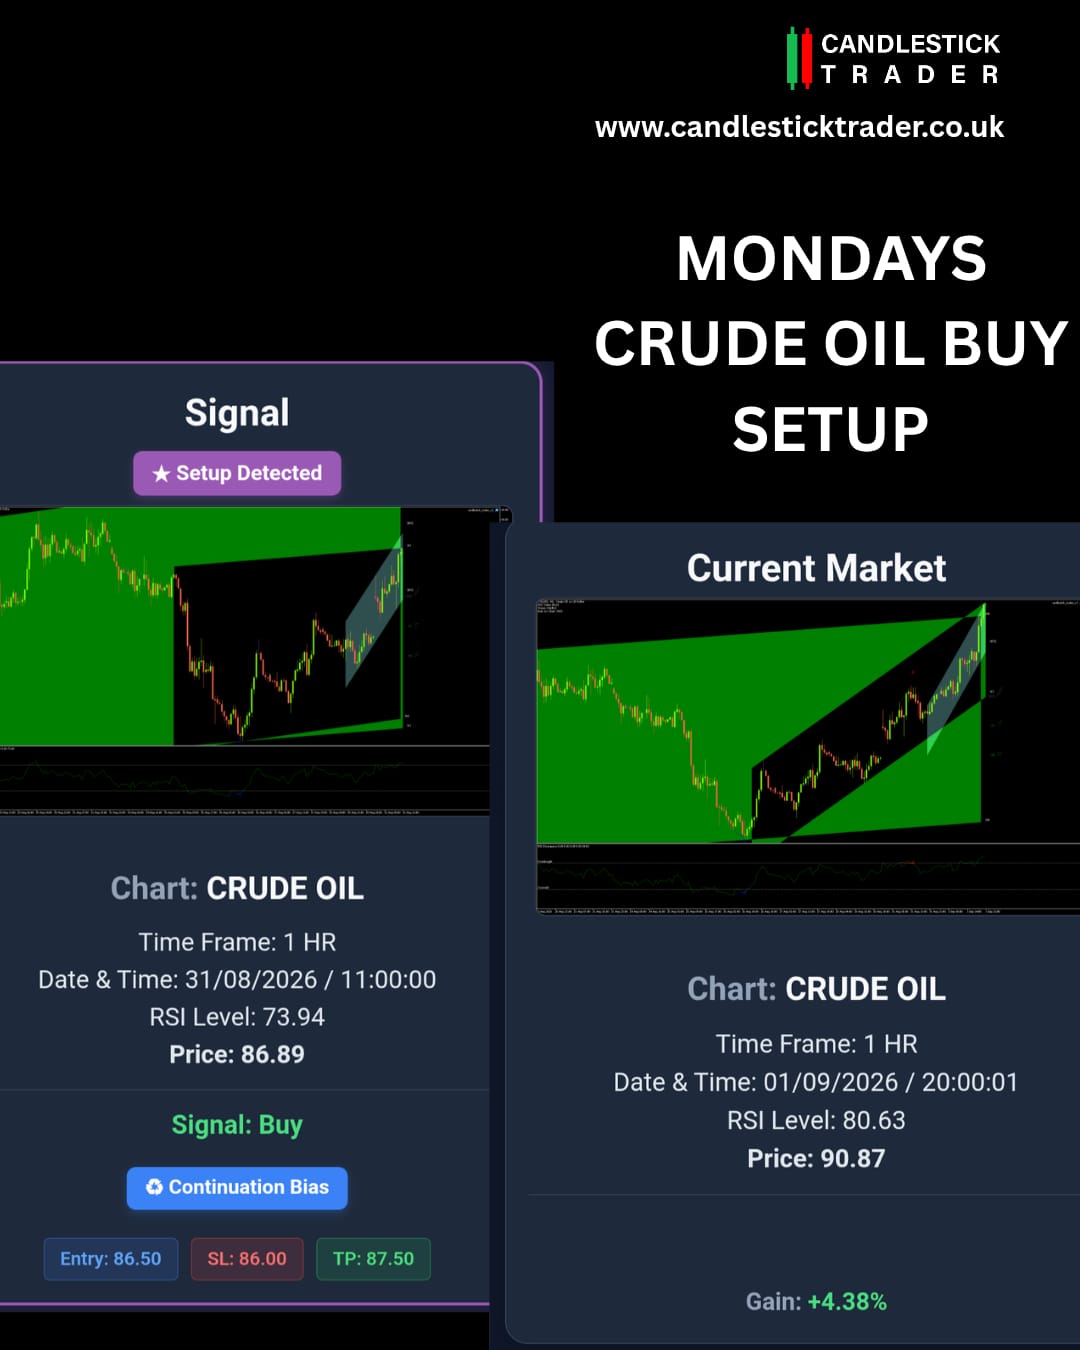
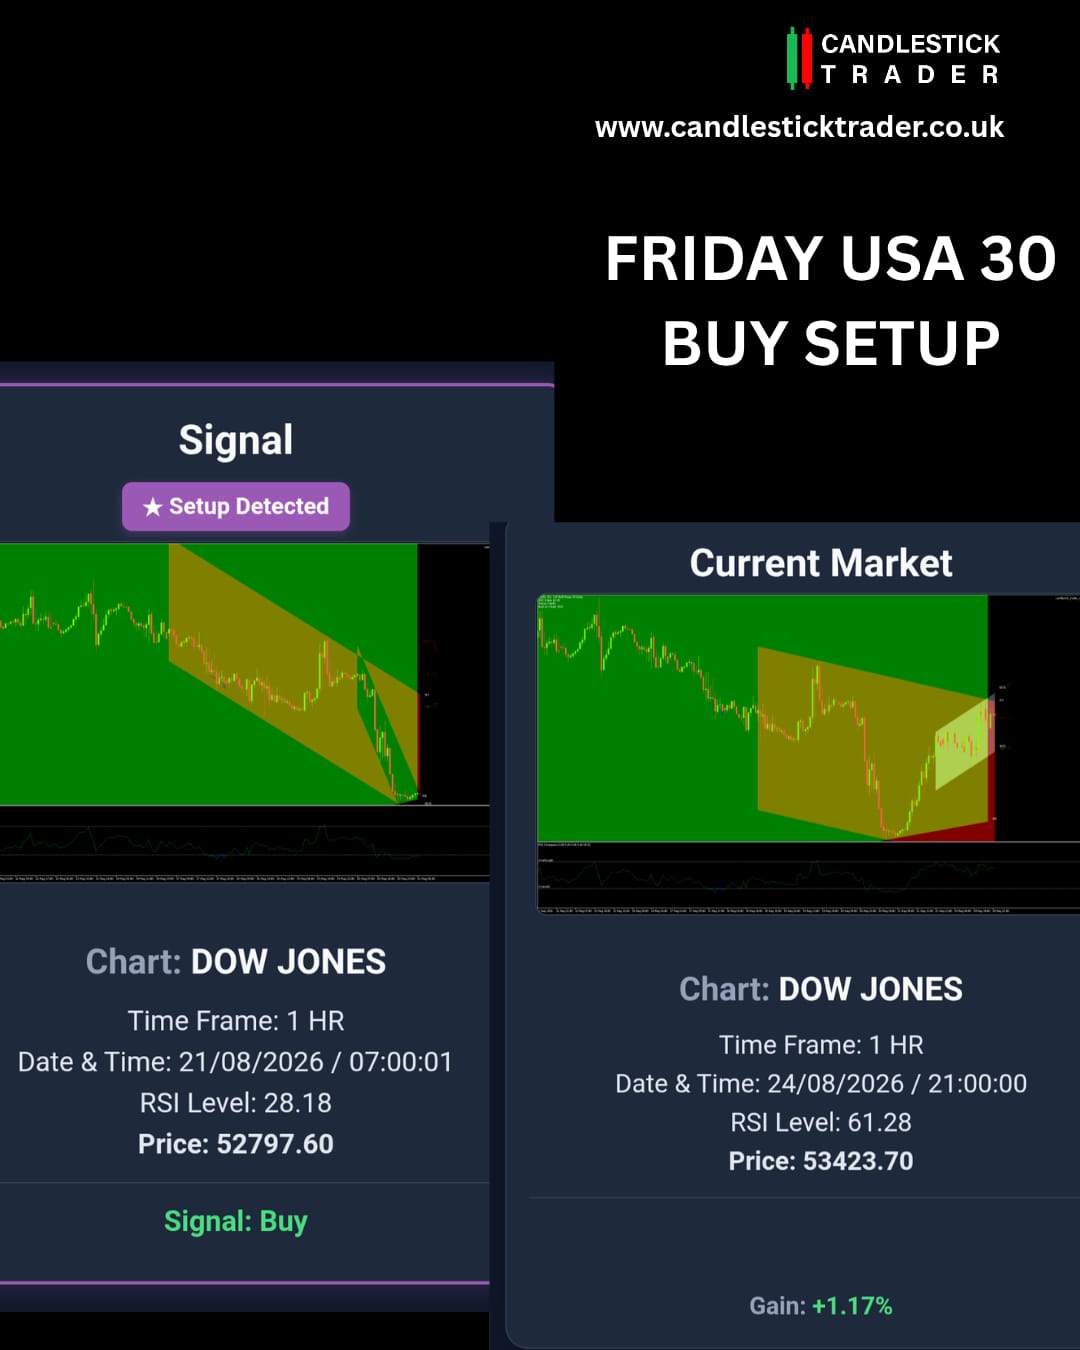
Complete historical record of candlestick pattern signals detected across forex, commodities and indices. Browse our chart archive to see real trade setups with entry points and technical analysis.
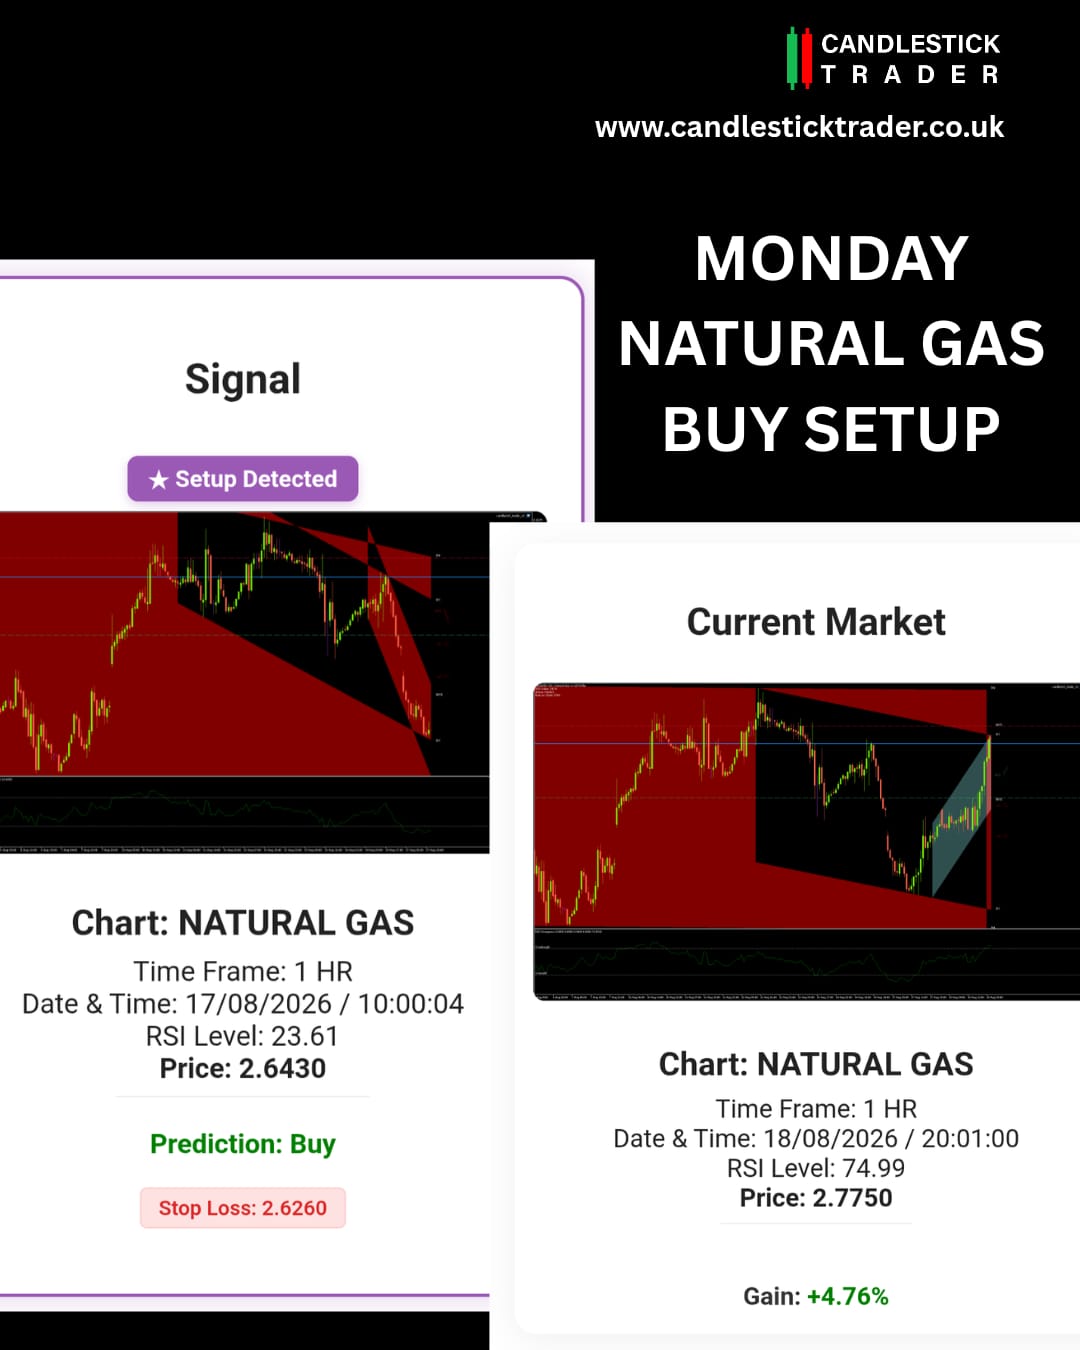
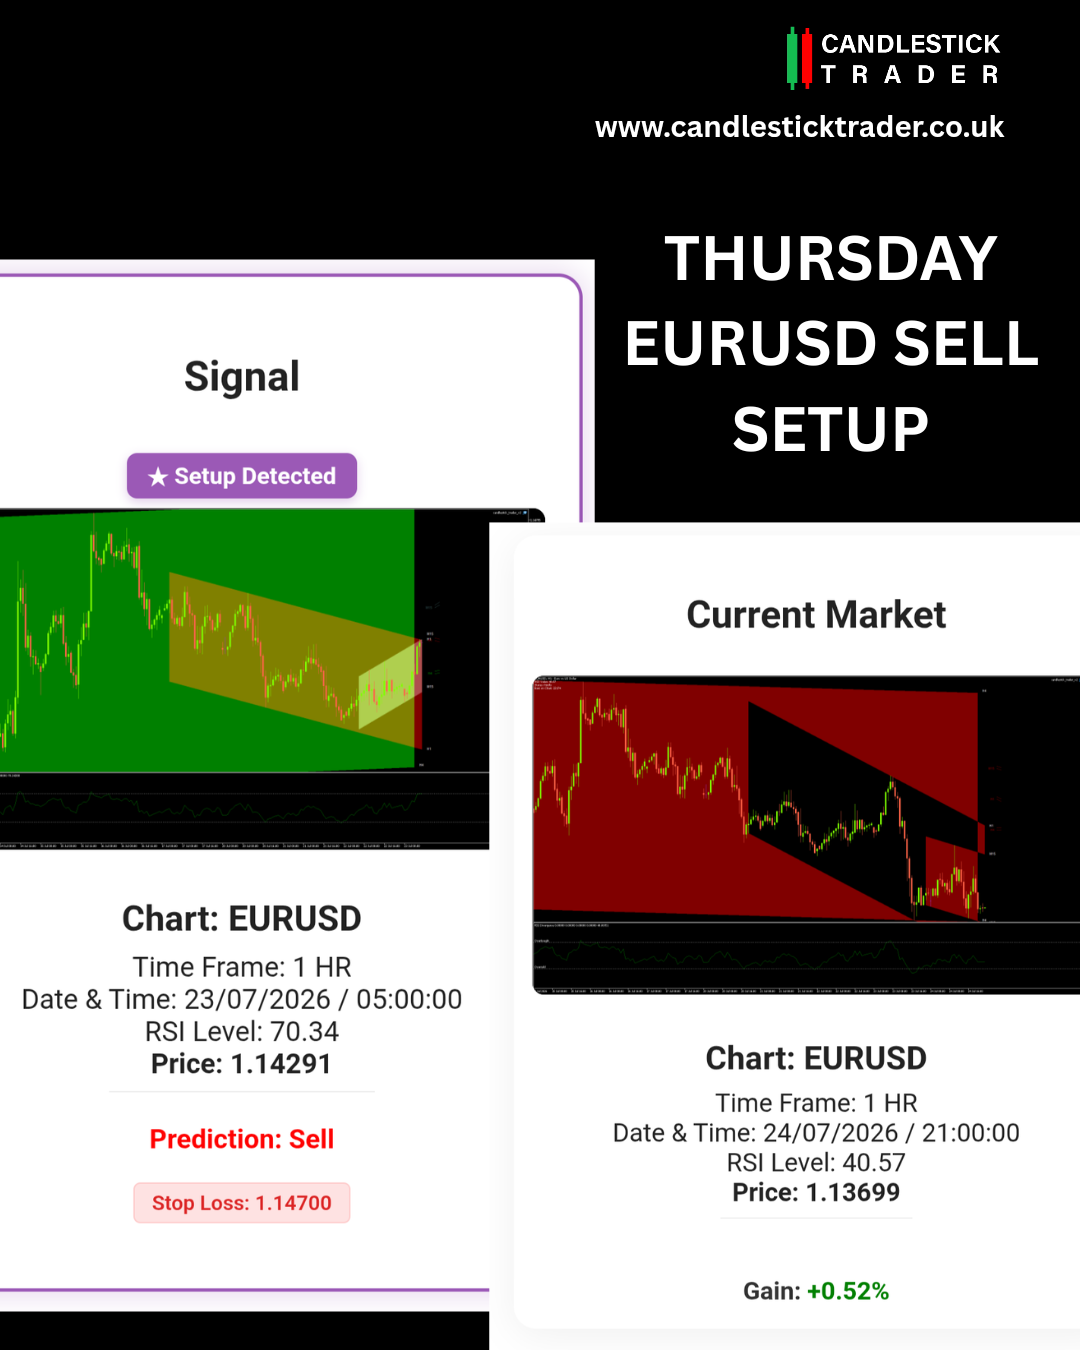
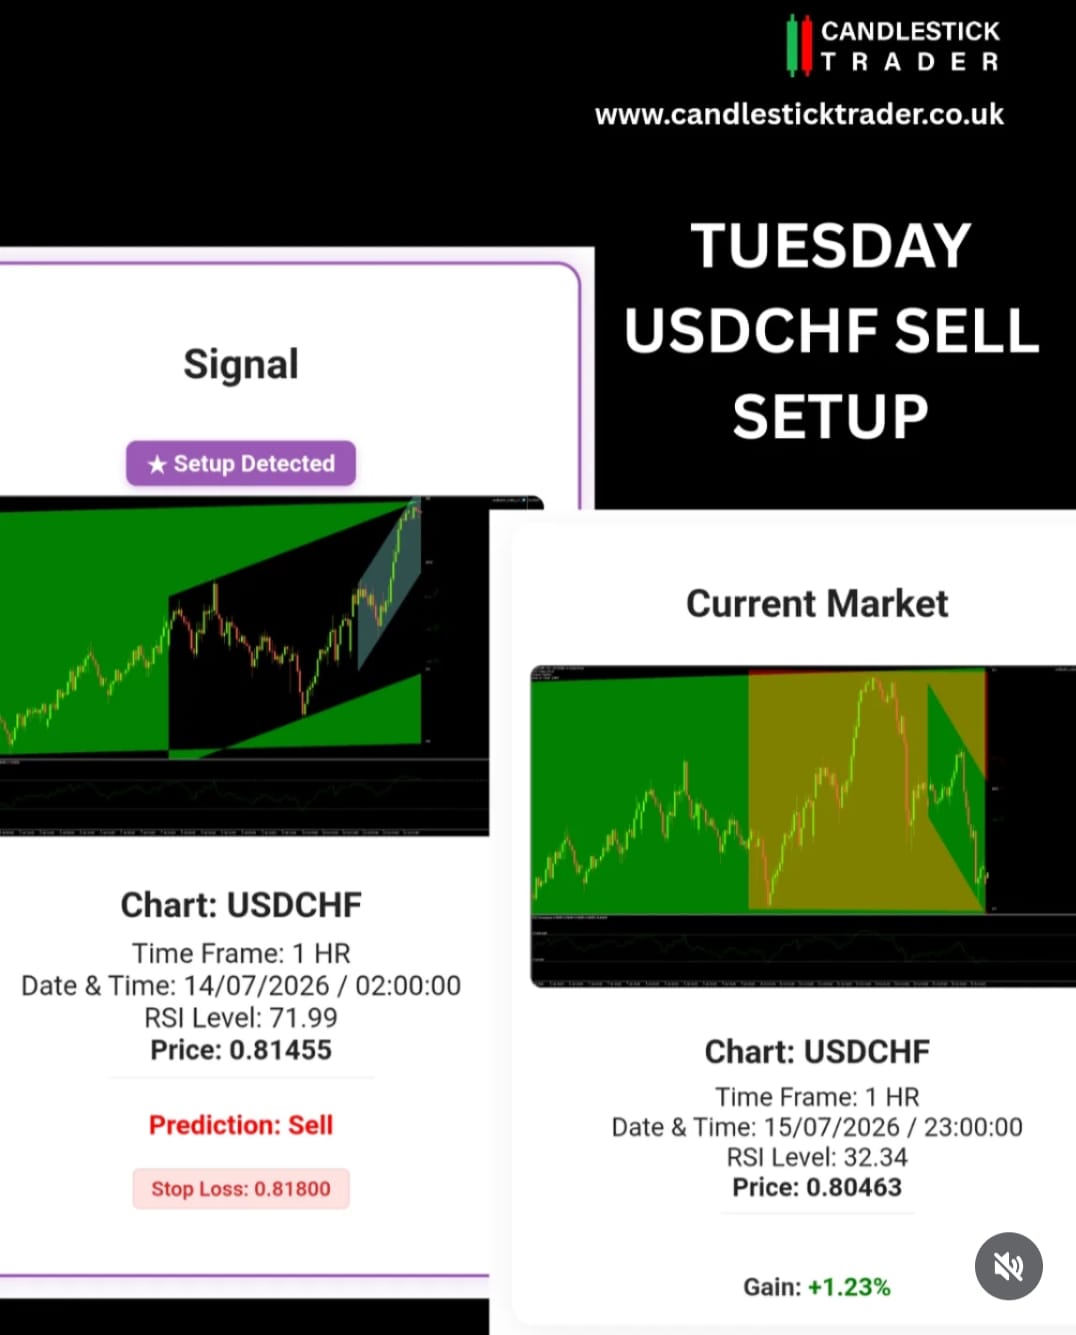
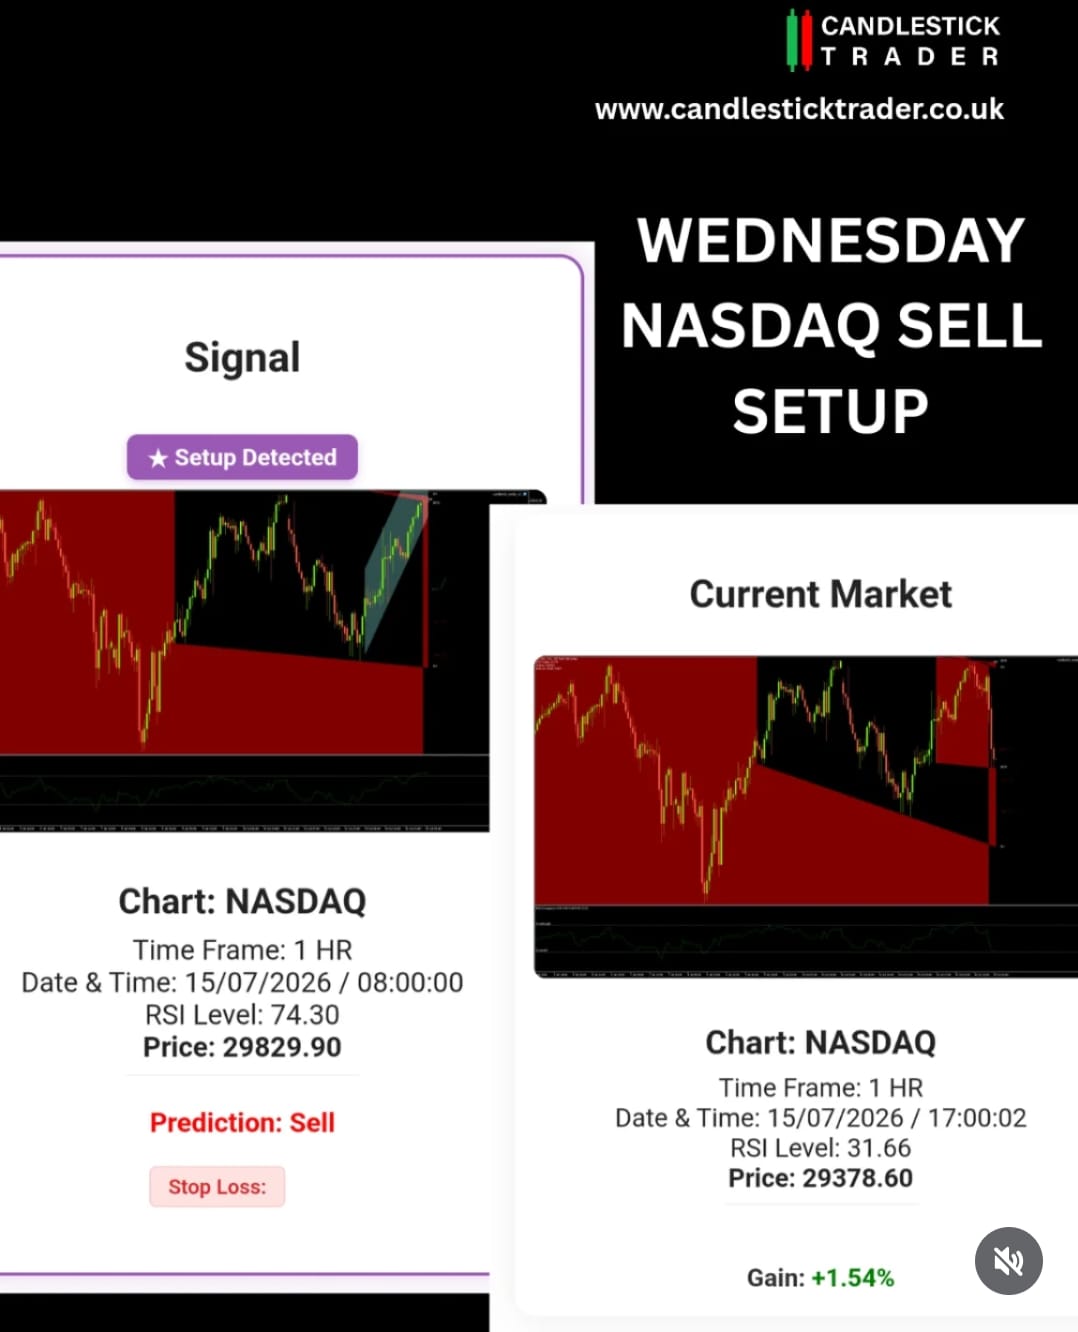
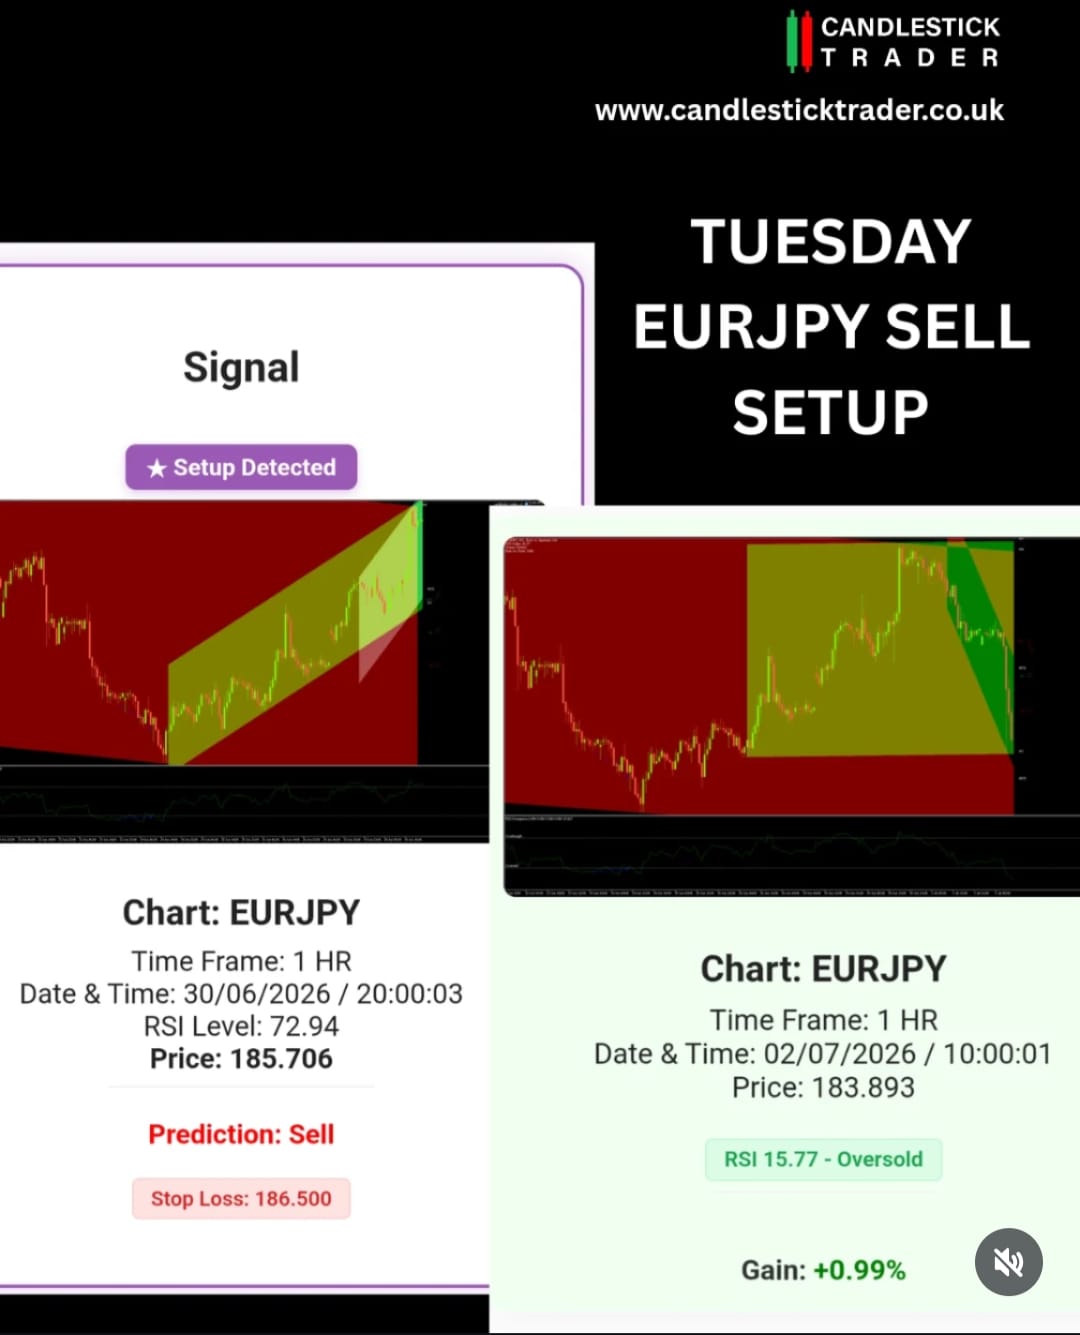
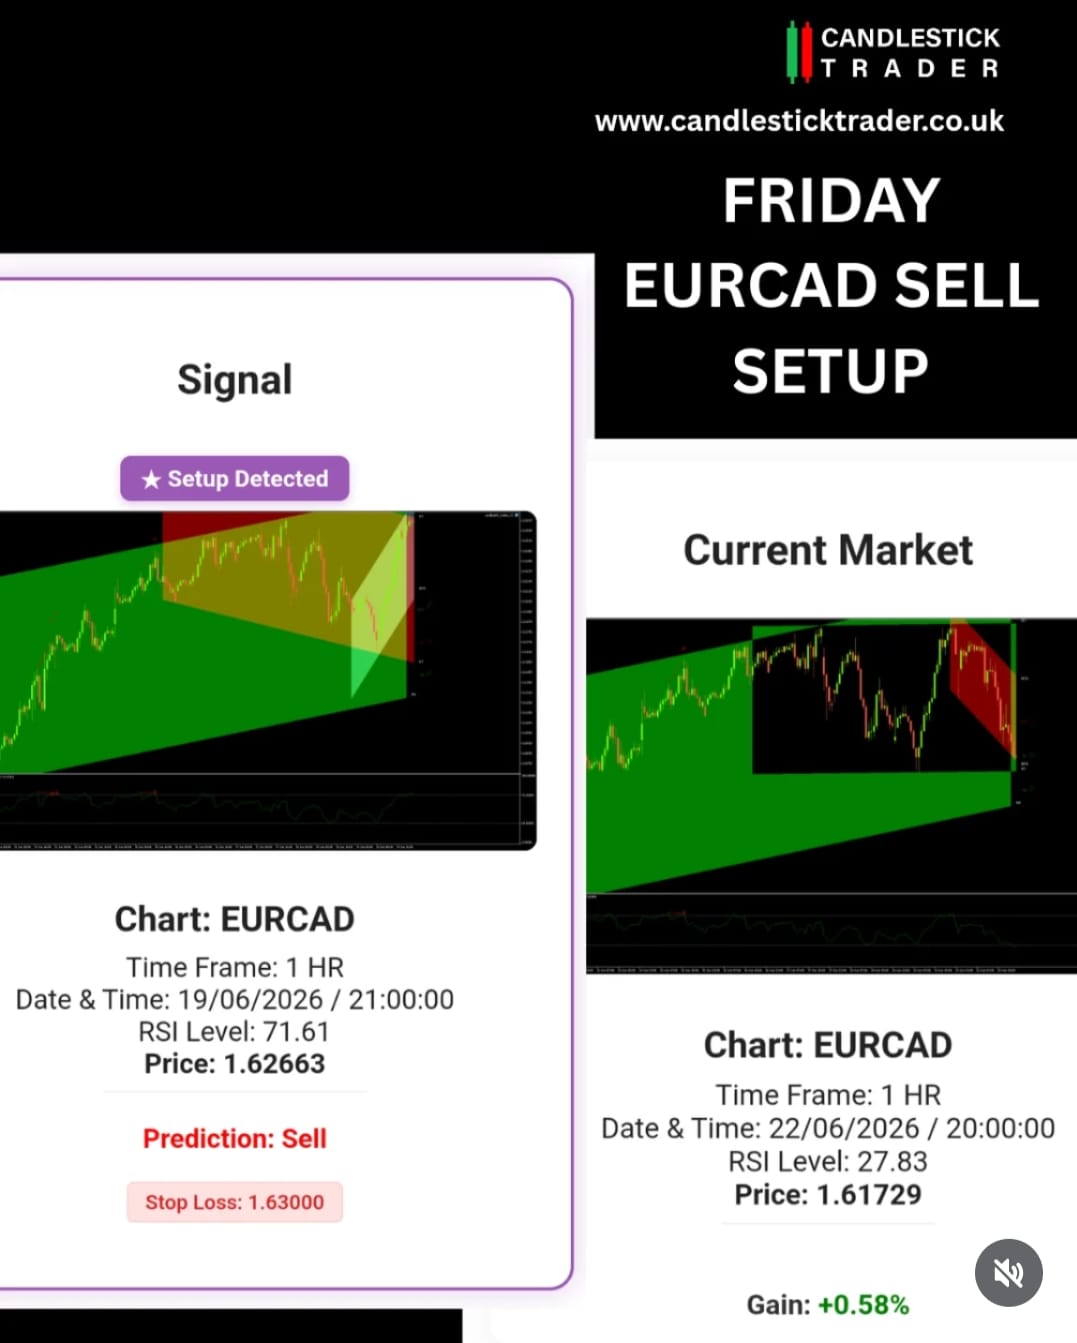
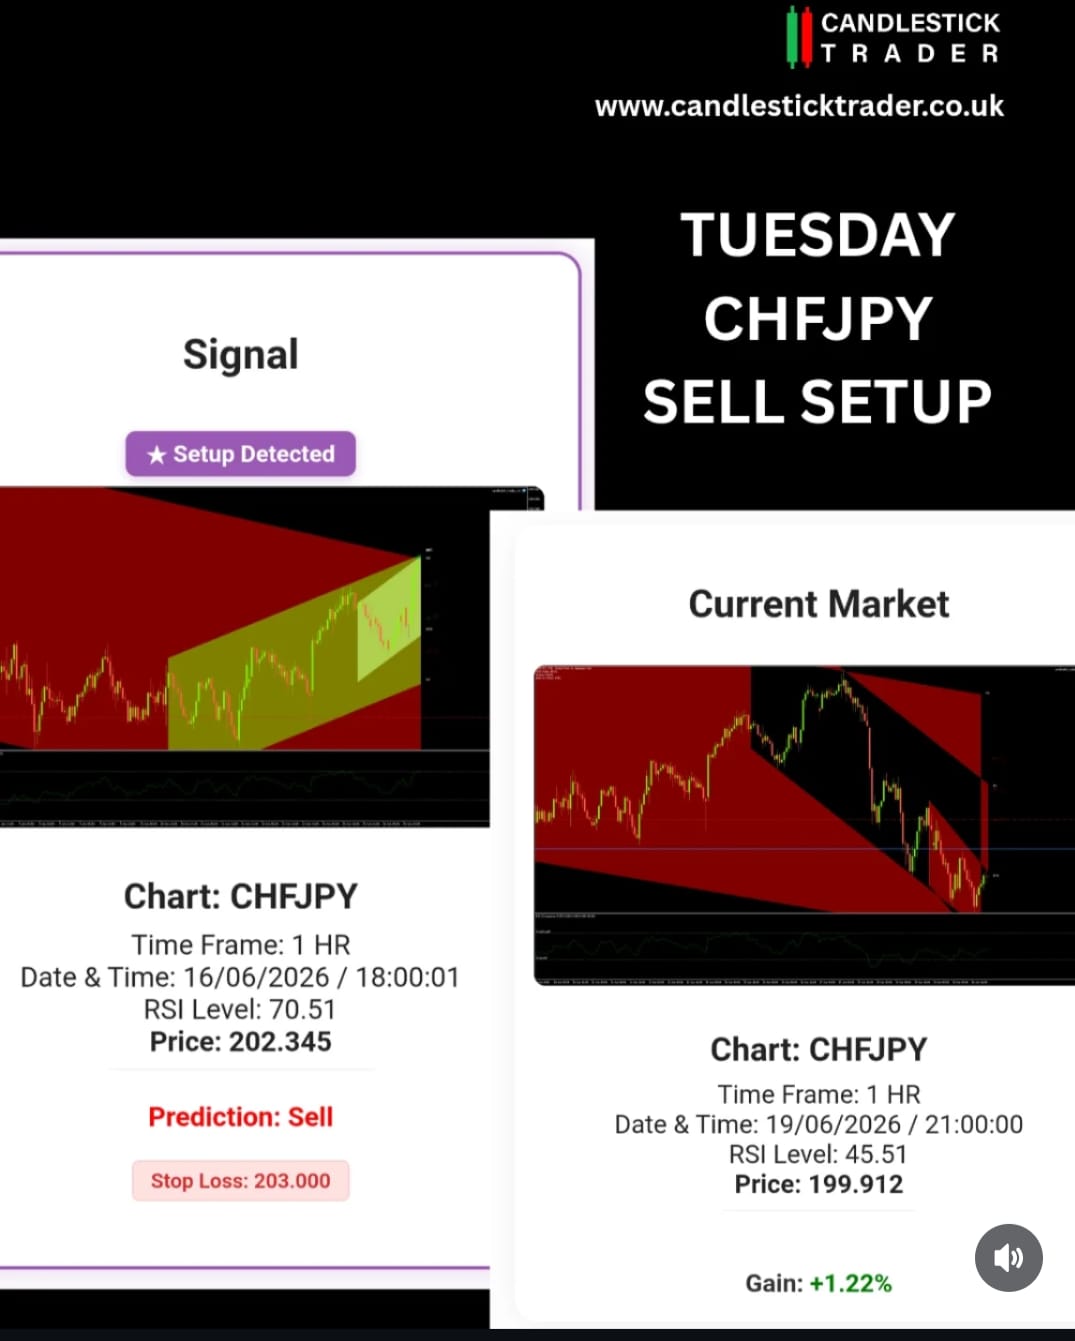
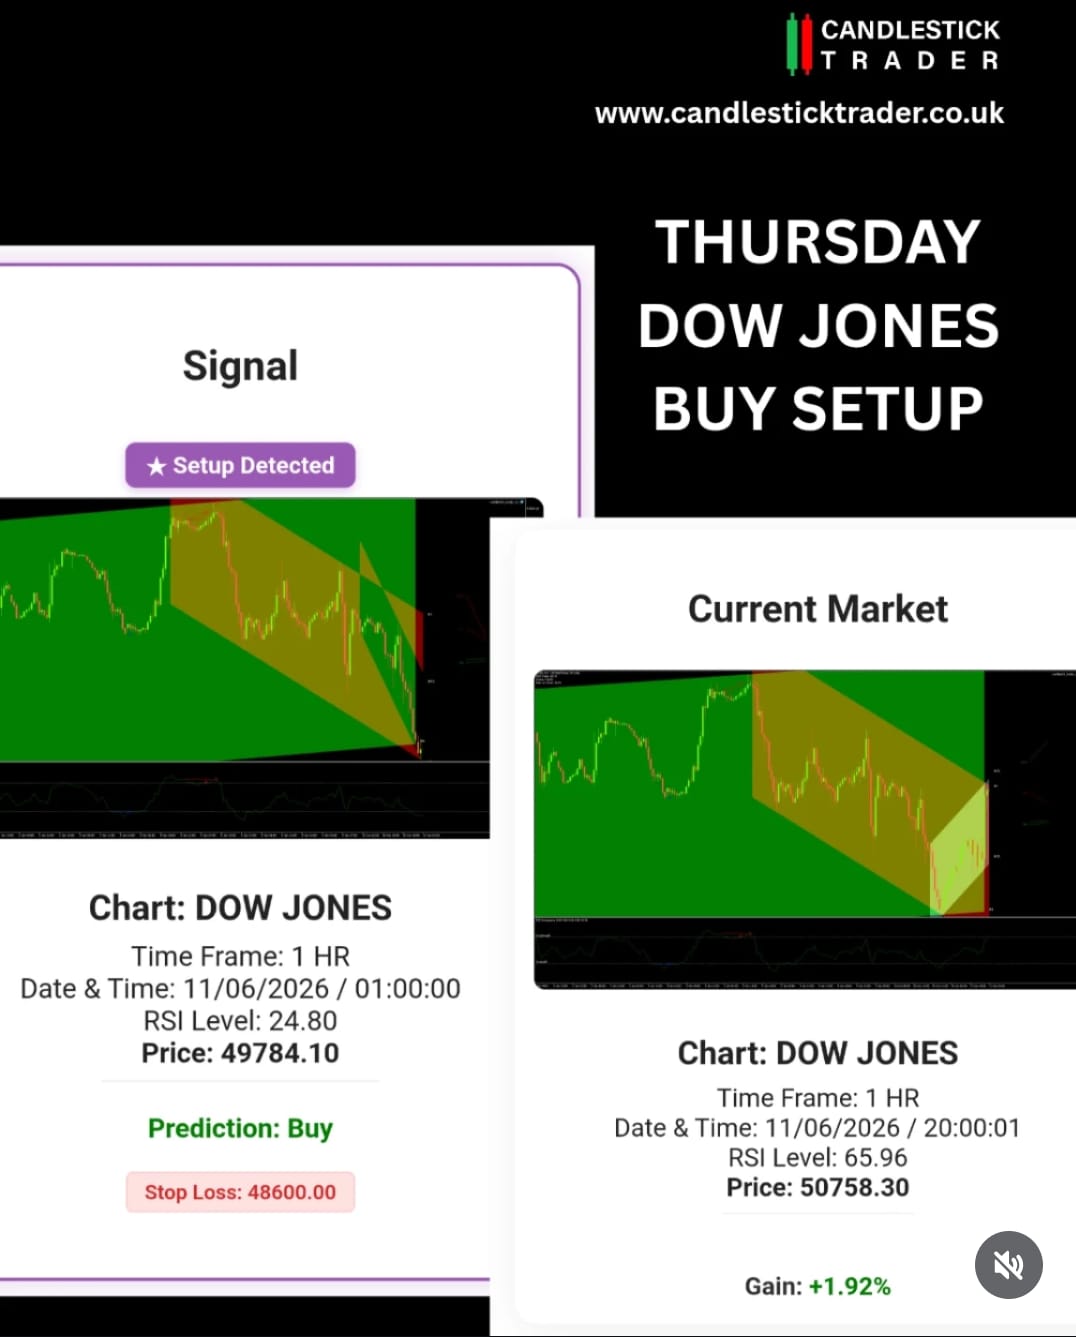
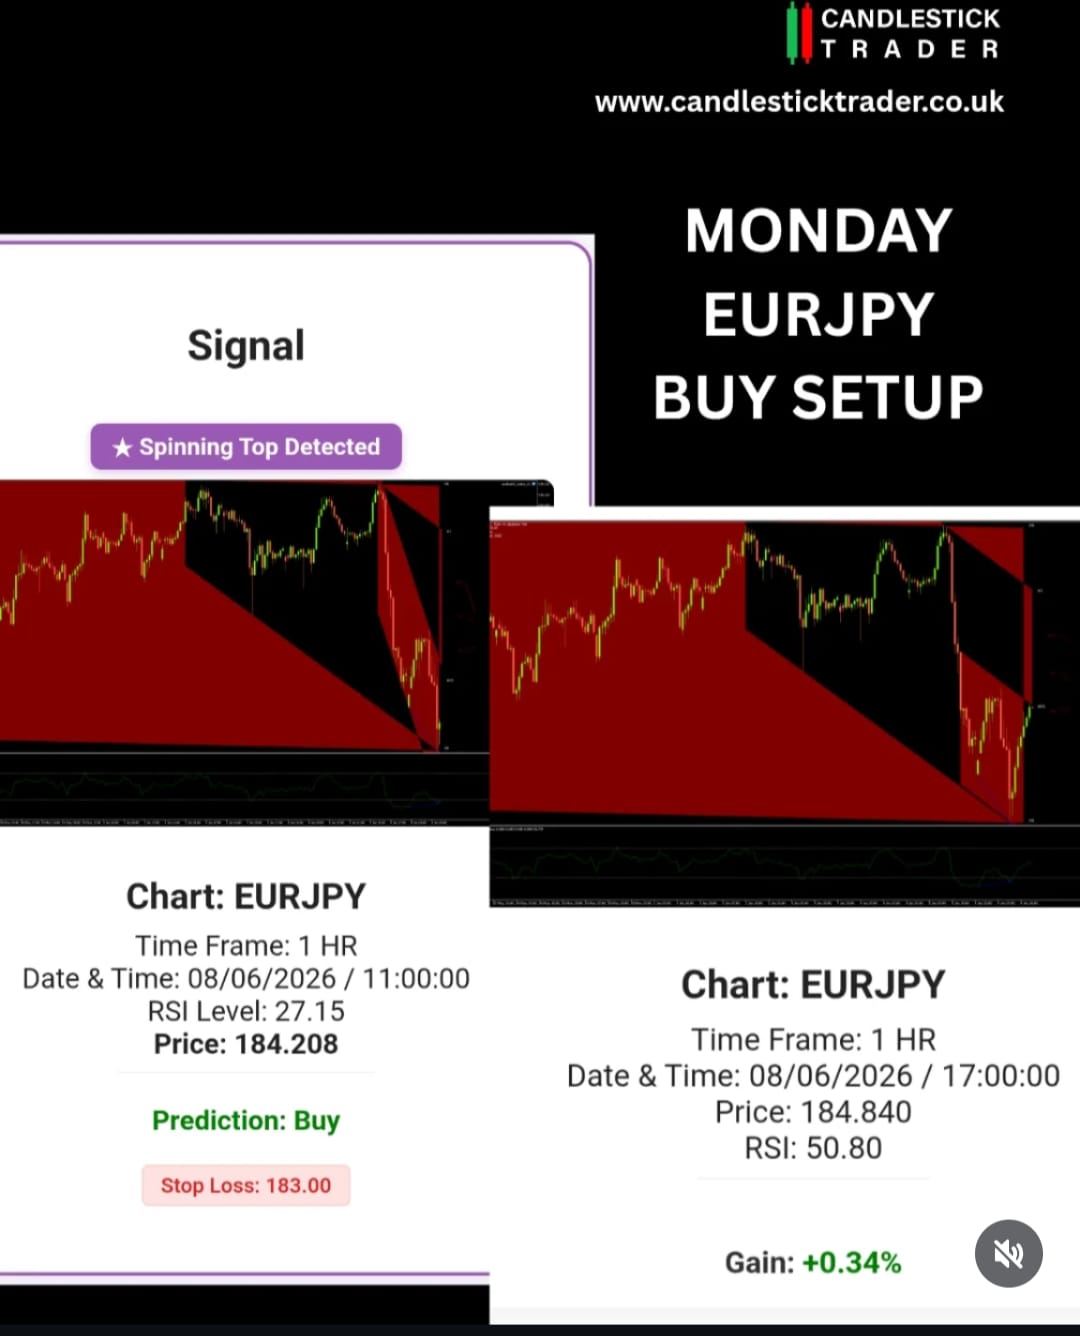
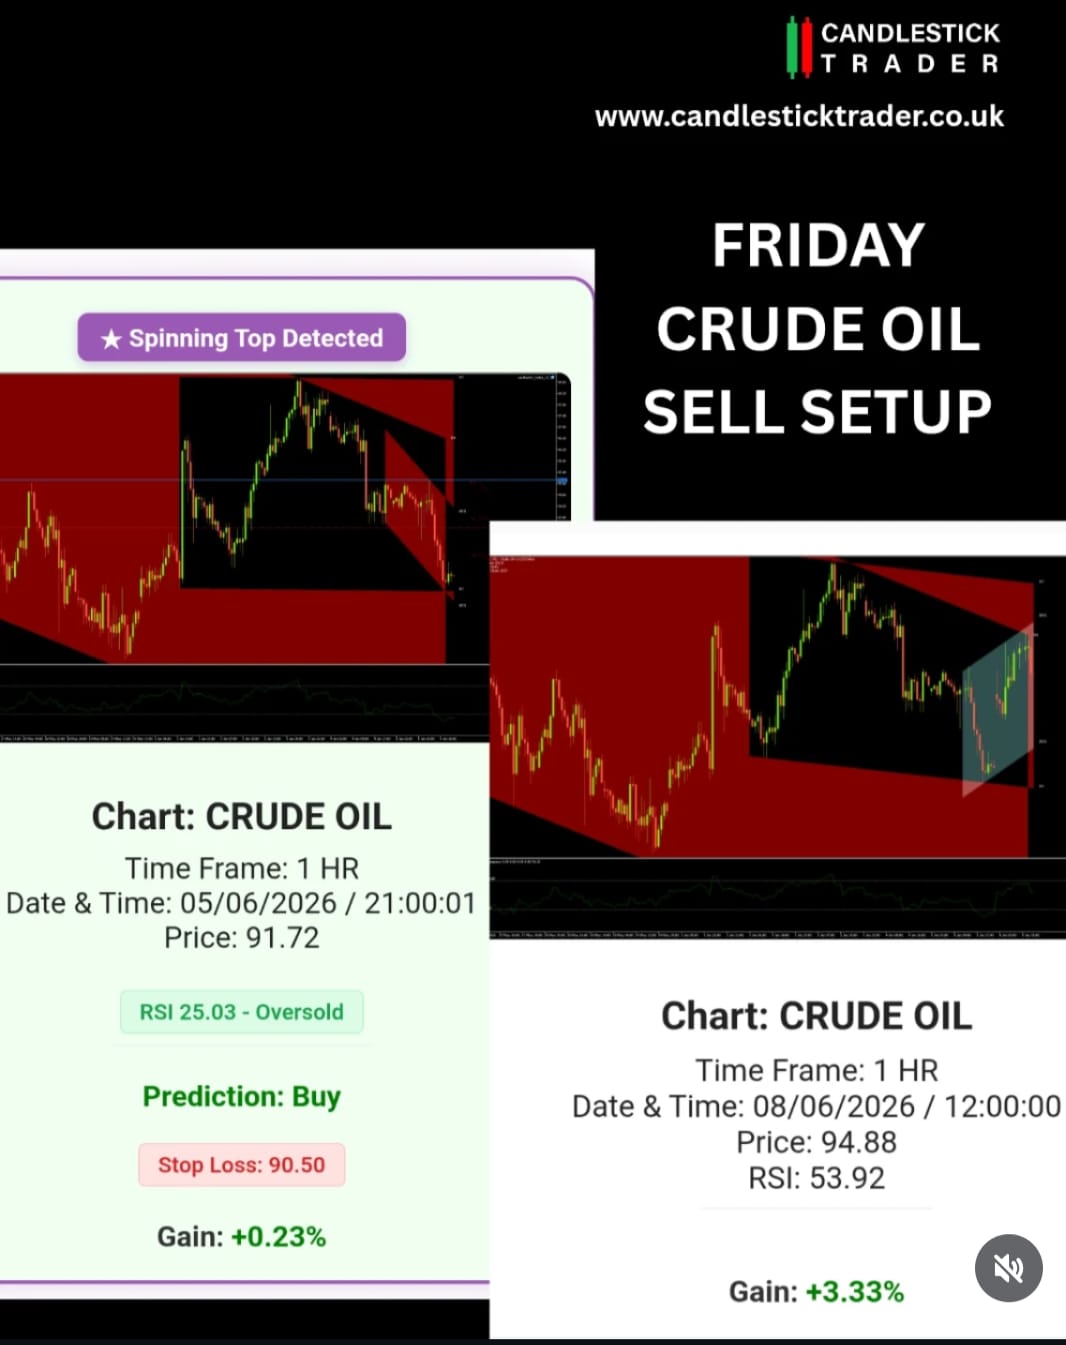
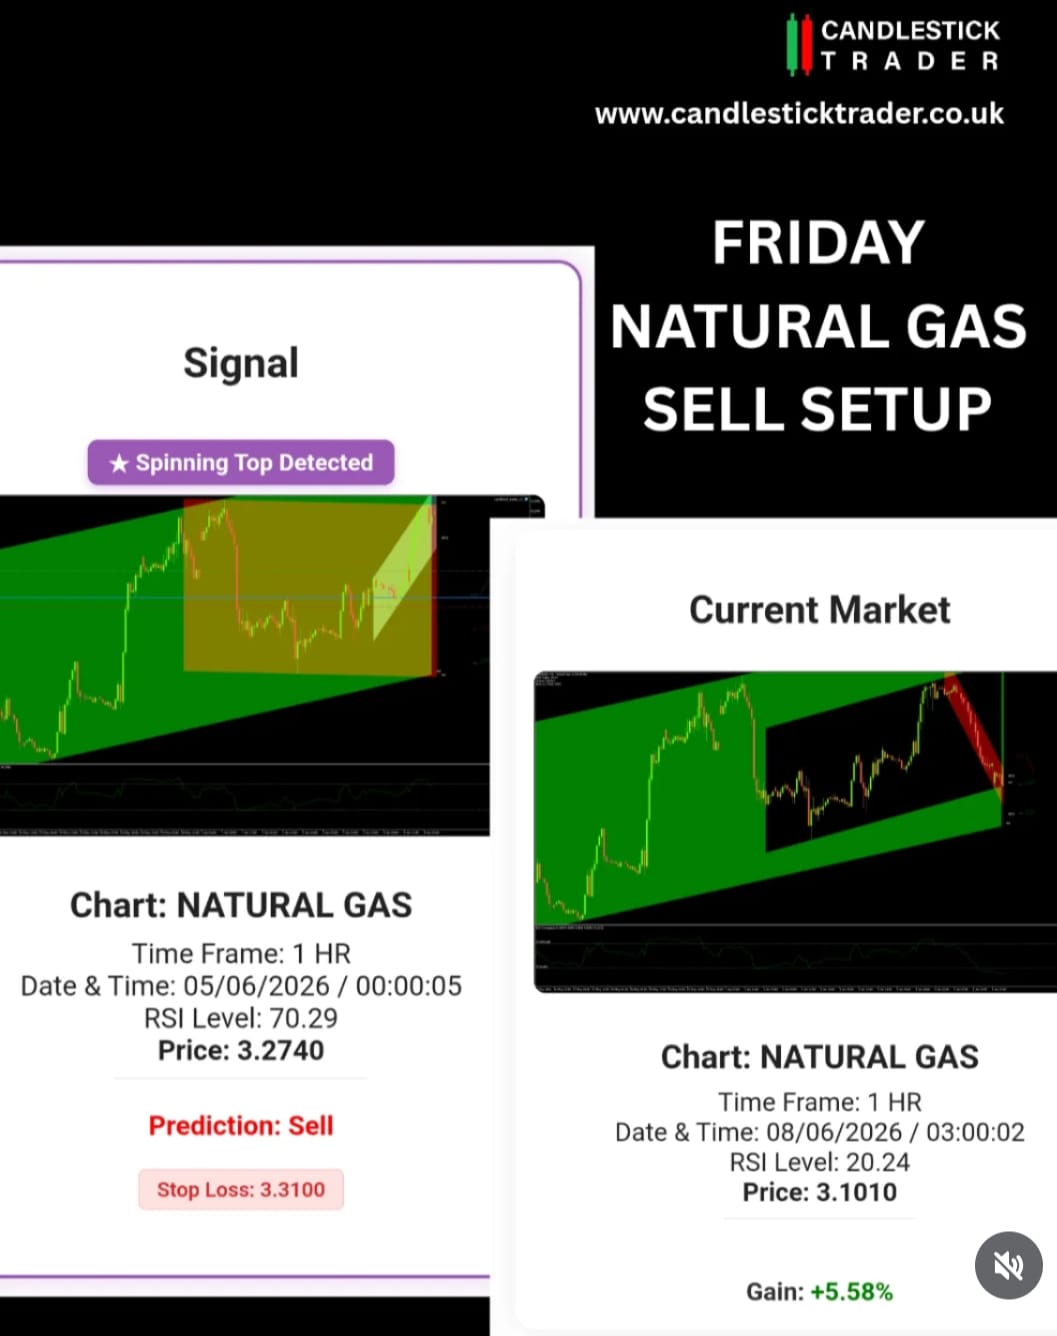
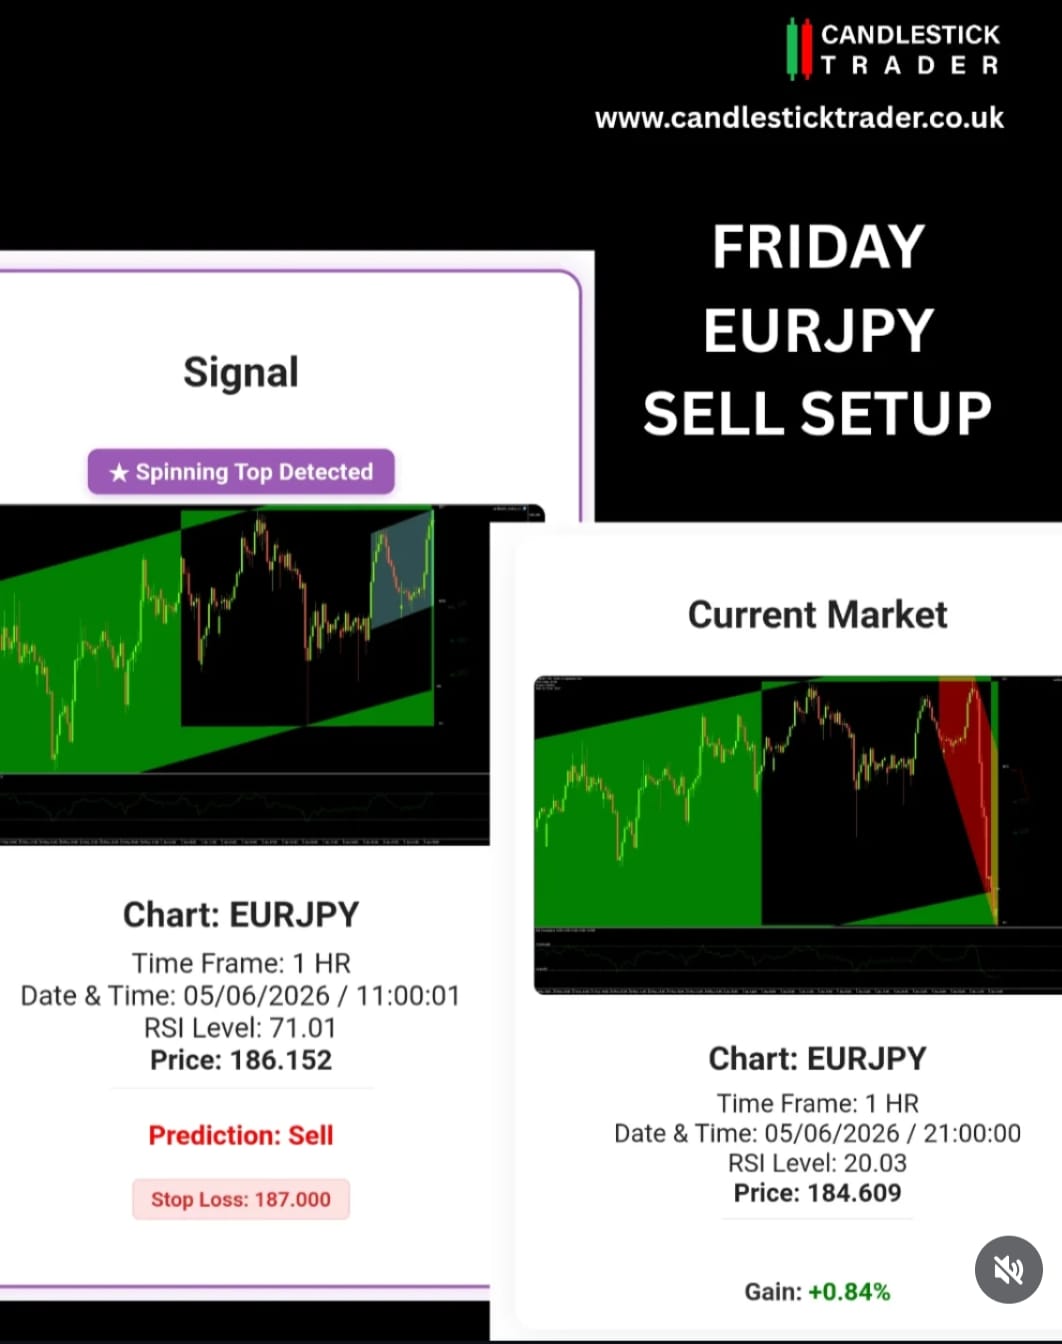
This archive displays every candlestick pattern signal our system has generated across forex, commodities and global indices markets. Each chart screenshot captures the exact moment our detection engine identified a high-probability setup, complete with the technical context that triggered the alert.
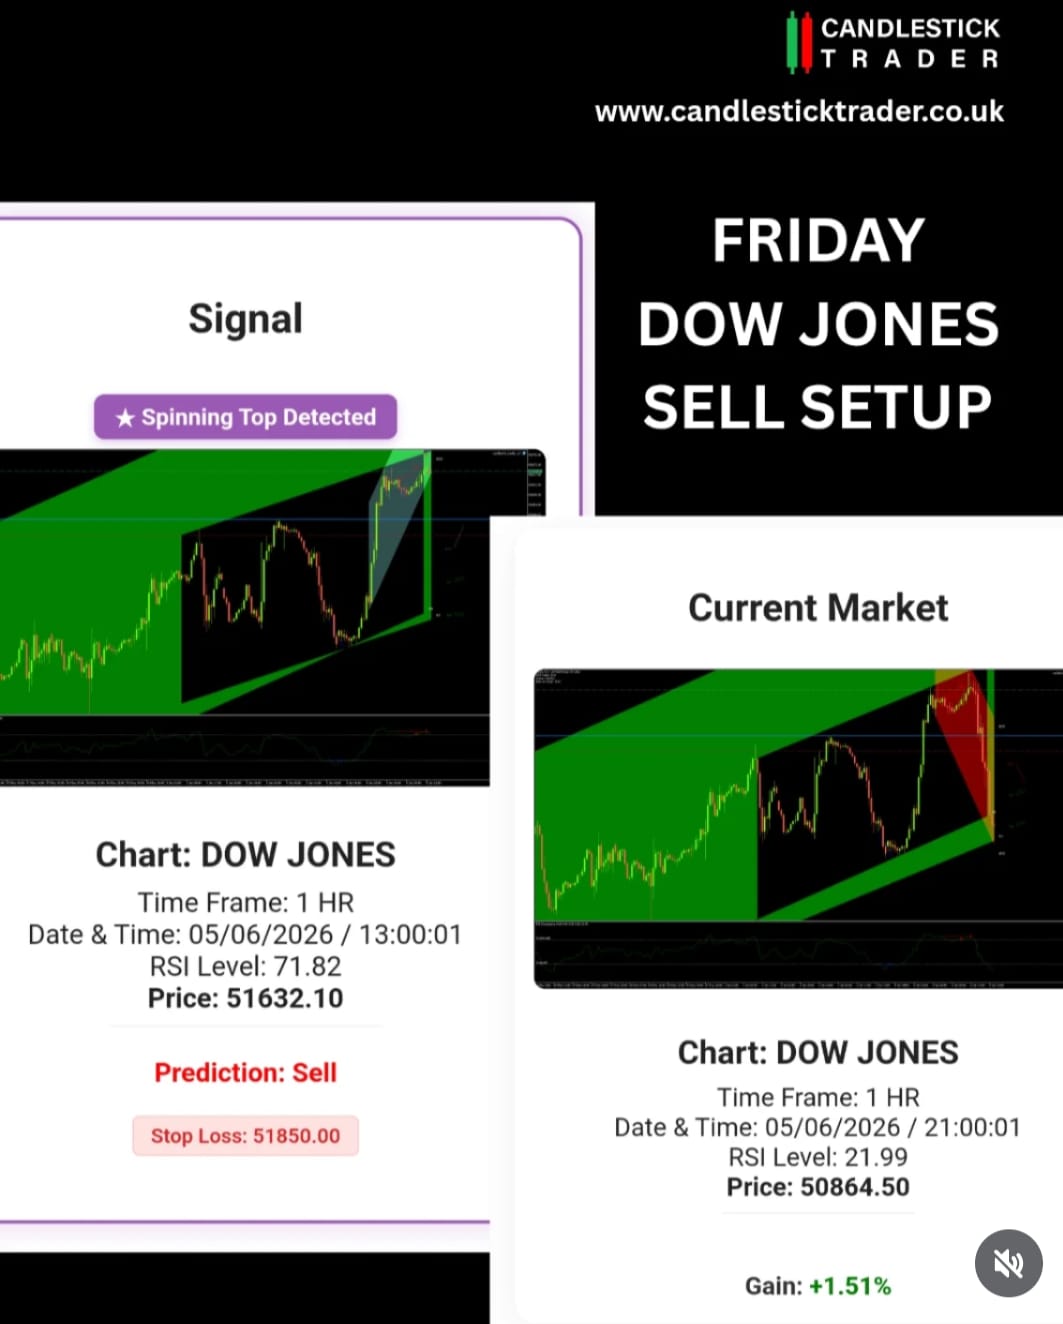
Our trading signal results are not back-tested hypotheticals - they are real-time detections captured as they happened. When you see a Buy or Sell label on a chart, that represents the precise candlestick formation, RSI divergence reading, and support or resistance level that combined to create a valid signal at that moment in time.
Each chart in this gallery shows the instrument, timestamp and signal type. Buy signals typically form around bullish reversal patterns such as hammer candles, morning stars or bullish engulfing formations at key support levels. Sell signals correspond to bearish patterns including shooting stars, evening stars and bearish engulfing candles near resistance.
We validate every pattern against RSI divergence to confirm momentum alignment. A bullish hammer at support with RSI showing positive divergence carries significantly higher probability than the same pattern without momentum confirmation. This dual-validation process is what separates our trading alerts from basic price notification services.
Our archive spans major forex pairs including EUR/USD, GBP/USD, USD/JPY and AUD/USD, where intraday candlestick patterns frequently develop at London and New York session overlaps. For commodity traders, our gold (XAU/USD) and oil (XTI/USD) signals capture volatile moves driven by geopolitical events and supply data releases.
Indices trading signals cover US30, USTEC (NASDAQ) and major European benchmarks. Index markets often produce cleaner candlestick patterns due to their high liquidity and institutional participation, making them ideal for pattern-based strategies. Browse the archive by symbol to see how specific instruments behave across different market conditions.
Beyond verifying our signal performance, this archive serves as a practical educational resource. Study how candlestick patterns form in real market conditions, observe the relationship between pattern location and subsequent price action, and build your own pattern recognition skills by comparing your chart analysis with our automated detections.
Every trader develops their edge through repetition and observation. By reviewing hundreds of past signals, you will internalise the visual characteristics of high-probability setups and learn to spot them independently. Combine this visual training with our live trading alerts to accelerate your development from novice to confident pattern trader.